By the end you'll know
- What logs answer that metrics can't
- How Loki stores logs: a few labels to find them, then reading the lines
- How Grafana Alloy collects every pod's log, and why it replaced Promtail
- How to write LogQL: choosing streams, filtering lines, pulling out fields, and counting
- Why a log label must have few values
- How to search logs in Grafana's Explore
Before you start
- You need: Lesson 8 done, and the Argo CD port-forward running, with
argocd logindone. - You need
helmon your Mac (brew install helm), to look up chart versions and render charts before merging them. - This lesson changes things: three pull requests, all adding. Nothing is broken on purpose this time.
- Check where kubectl points:
kubectl config current-contextshould saykind-gitops.
The short version
- Loki stores logs. It indexes only a few labels per stream, not the text, which keeps it cheap: it finds the right streams by label, then reads their lines.
- Alloy follows every container's log through the Kubernetes API and sends each line to Loki, labelled with its namespace, pod, container and app.
- LogQL searches them. In 10 minutes, staging served 60 requests to the kubelet's probe, 40 to the blackbox exporter and 20 to the nginx exporter; a visitor's four failed requests showed up by path.
- Prometheus, for the same requests: one number,
390, with no paths and no status codes. - Grafana has Loki as a data source, so logs and metrics sit side by side in Explore.
Metrics say that, logs say why
Lesson 7's BookshopDown says the shop isn't answering. Lesson 4's request rate says how many requests there were. Neither says which page failed, what error a program printed, or who asked. Those are in the logs: the lines every program writes as it works. nginx writes one per request:
10.244.1.1 - - [06/Nov/2026:00:22:38 +0000] "GET / HTTP/1.1" 200 7754 "-" "kube-probe/1.35" "-"
Who asked (10.244.1.1), when, what (GET /), the answer (200, and 7754 bytes), and what was asking (kube-probe/1.35, the kubelet's readiness probe). kubectl logs shows these already. But only for one pod, only while it exists, and only what that pod's node still keeps. A shop with ten pods, or a pod that crashed an hour ago, needs the lines collected somewhere that keeps them and can search them.
Two parts: Loki and Alloy
- Loki stores the lines and answers queries about them. It's Prometheus's idea applied to logs: each stream of lines has a few labels, such as
namespaceandcontainer, and only those labels are indexed. The text itself isn't. A query names labels to choose streams, and Loki reads through those streams' lines. Storing labels instead of indexing every word is why Loki is cheap to run. - Grafana Alloy collects. It finds every pod, follows each container's log, gives each stream its labels, and sends the lines to Loki.
Many guides use Promtail for collecting. It reached its end of life on March 2, 2026: no more updates, not even security fixes. Alloy is its replacement, and does metrics and traces as well as logs.
Finding the charts
Both come as Helm charts, from two different places:
$ helm search repo grafana-community/loki --versions | head -4
NAME                  	CHART VERSION	APP VERSION	DESCRIPTION
grafana-community/loki	21.0.0       	3.7.9      	Helm chart for Grafana Loki supporting monolith...
grafana-community/loki	20.4.1       	3.7.9      	Helm chart for Grafana Loki supporting monolith...
grafana-community/loki	20.4.0       	3.7.9      	Helm chart for Grafana Loki supporting monolith...

$ helm search repo grafana/alloy --versions | head -4
NAME                  	CHART VERSION	APP VERSION	DESCRIPTION
grafana/alloy         	1.15.0       	v1.21.3    	Grafana Alloy
grafana/alloy         	1.14.4       	v1.21.3    	Grafana Alloy
grafana/alloy         	1.14.3       	v1.21.2    	Grafana Alloy
Loki's chart moved. Most guides say grafana/loki. That chart is now only for Grafana Enterprise Logs, the paid version; the open one lives at https://grafana-community.github.io/helm-charts. Chart 21.0.0, for Loki 3.7.9, and Alloy's chart 1.15.0, pinned in Git as always, so an upgrade is a pull request someone chose.
Loki, in Git
Loki can run as one program or as a dozen separate parts. On a laptop, one. The values for argocd/loki.yaml:
# Monolithic: every part of Loki in one pod. Enough for a laptop, up to tens of GB a day.
deploymentMode: Monolithic
loki:
  # One tenant, no logins: everything in this cluster shares one set of logs.
  auth_enabled: false
  commonConfig:
    replication_factor: 1
  # Chunks and index on the pod's own disk, not in a cloud bucket.
  storage:
    type: filesystem
  # How logs are stored and indexed, from this date on. v13 and tsdb are today's format.
  schemaConfig:
    configs:
      - from: "2024-04-01"
        store: tsdb
        object_store: filesystem
        schema: v13
        index:
          prefix: index_
          period: 24h
  # Keep 3 days of logs: the compactor deletes older ones.
  compactor:
    retention_enabled: true
    delete_request_store: filesystem
  limits_config:
    retention_period: 72h
singleBinary:
  replicas: 1
  persistence:
    size: 2Gi
  resources:
    requests:
      cpu: 100m
      memory: 256Mi
    limits:
      memory: 1Gi
# The scalable modes' parts: none.
read:
  replicas: 0
write:
  replicas: 0
backend:
  replicas: 0
# Extras this lesson doesn't need: a gateway in front, two memcached caches (one asks
# for 8 GB of memory), a canary writing test logs, Helm's test, and the rules sidecar.
gateway:
  enabled: false
chunksCache:
  enabled: false
resultsCache:
  enabled: false
lokiCanary:
  enabled: false
test:
  enabled: false
sidecar:
  rules:
    enabled: false
deploymentMode: Monolithic, withsingleBinary.replicas: 1: one pod doing everything. The chart's default forsingleBinary.replicasis 0, so without this line there'd be no Loki at all.auth_enabled: false: Loki can keep separate tenants, each team's logs apart, and expects every request to say which. With one tenant, no need.storage.type: filesystem: logs on the pod's own disk, a 2 GB volume. Real installs use a bucket, such as S3; more on that below.schemaConfig: how Loki lays out what it stores, from a date on. Changing it later means adding a new entry with a later date, never editing this one.- Retention: without it, Loki keeps everything until the disk fills. The compactor deletes logs older than 72 hours.
- The extras, off. The chart's defaults are for a real cluster: three of each scalable part, a gateway, and two caches, one asking for 8 GB of memory. Each would be a pod this laptop doesn't need.
Before merging, the chart rendered on the laptop with these values, to see what it would make, and to stop if the values were wrong:
helm template loki grafana-community/loki --version 21.0.0 -n monitoring -f /tmp/loki-values.yaml | grep '^kind:' | sort | uniq -c
helm templaterenders a chart to plain Kubernetes YAML, without installing anything. A wrong value fails here, on the laptop, not in the cluster.grep '^kind:' | sort | uniq -ccounts what it would create, by kind.
   1 kind: ClusterRole
   1 kind: ClusterRoleBinding
   2 kind: ConfigMap
   3 kind: Service
   2 kind: ServiceAccount
   1 kind: StatefulSet
One StatefulSet: one pod with its own disk. Merged as #66:
after 55s: loki Synced Healthy

NAME                    READY   AGE
statefulset.apps/loki   1/1     53s

NAME         READY   STATUS    RESTARTS   AGE
pod/loki-0   1/1     Running   0          53s

NAME                                   STATUS   VOLUME                                     CAPACITY   ACCESS MODES   STORAGECLASS   VOLUMEATTRIBUTESCLASS   AGE
persistentvolumeclaim/storage-loki-0   Bound    pvc-fb7f79c4-6702-4760-8ad7-099376789b68   2Gi        RWO            standard       <unset>                 53s
The disk is a PersistentVolumeClaim, Bound to a volume that kind's standard storage class made. Loki has an HTTP API (Application Programming Interface) on port 3100, like Prometheus's on 9090. With a port-forward:
kubectl port-forward -n monitoring svc/loki 3100:3100
curl -s http://localhost:3100/ready; echo
curl -s http://localhost:3100/loki/api/v1/labels; echo
ready

{"status":"success"}
Ready, and no labels: nothing has sent it a line yet.
Alloy, in Git
Alloy's settings are in its own language, a few named blocks wired together. The values for argocd/alloy.yaml:
# One copy for the whole cluster: it reads logs through the Kubernetes API, so it
# doesn't need a copy on every node, or access to the nodes' disks.
controller:
  type: deployment
  replicas: 1
alloy:
  configMap:
    content: |
      // Find every pod in the cluster, and keep finding them as they come and go.
      discovery.kubernetes "pods" {
        role = "pod"
      }

      // Turn what Kubernetes knows about each pod into the labels to search by.
      discovery.relabel "pods" {
        targets = discovery.kubernetes.pods.targets

        rule {
          source_labels = ["__meta_kubernetes_namespace"]
          target_label  = "namespace"
        }
        rule {
          source_labels = ["__meta_kubernetes_pod_name"]
          target_label  = "pod"
        }
        rule {
          source_labels = ["__meta_kubernetes_pod_container_name"]
          target_label  = "container"
        }
        rule {
          source_labels = ["__meta_kubernetes_pod_label_app_kubernetes_io_name"]
          target_label  = "app"
        }
      }

      // Follow each container's log, as kubectl logs -f does.
      loki.source.kubernetes "pods" {
        targets    = discovery.relabel.pods.output
        forward_to = [loki.write.default.receiver]
      }

      // And send every line to Loki.
      loki.write "default" {
        endpoint {
          url = "http://loki.monitoring.svc:3100/loki/api/v1/push"
        }
      }
Four blocks, each passing its result to the next, like a pipe:
discovery.kubernetesasks Kubernetes for every pod, and keeps the list current. Each pod comes with what Kubernetes knows about it, as labels starting__meta_kubernetes_.discovery.relabelpicks four of those and gives them short names. This is the same relabelling as Prometheus's, from Lesson 4. Labels starting with__are internal and never reach Loki; only these four, and a few Loki adds, do.loki.source.kubernetesfollows each container's log through the Kubernetes API, exactly askubectl logs -fdoes.loki.writesends the lines to Loki's push address.
The usual way to collect logs is a copy of the collector on every node, reading log files from the node's disk. That needs access to the node. Following logs through the API needs only permission to read them, which the chart's role grants, and one copy is enough for a small cluster. The cost is more work for the API and the kubelets, fine at this size. Merged as #67:
after 43s: alloy Synced Healthy

NAME                         READY   STATUS    RESTARTS   AGE
pod/alloy-676cd5c9b8-bbrm8   2/2     Running   0          41s
Two containers: Alloy, and a helper that reloads it when its settings change. And straight away, Loki's labels, and the values of one of them:
curl -s http://localhost:3100/loki/api/v1/labels | jq -c .data
curl -s http://localhost:3100/loki/api/v1/label/namespace/values | jq -c .data
["__stream_shard__","app","container","instance","job","namespace","pod","service_name"]
["argocd","bookshop","bookshop-staging","guestbook","kube-system","local-path-storage","monitoring"]
Every namespace's logs, from Alloy's first minute. The four labels from the relabel rules are there, and four more:
jobandinstance, added byloki.source.kubernetes, naming the namespace, pod and container a stream came from.service_name, added by Loki itself, from the app or container name. Grafana uses it to group logs by service.__stream_shard__, also Loki's: it splits a very busy stream into pieces. Internal; never search by it.
How many streams, one per container:
curl -s -G http://localhost:3100/loki/api/v1/series --data-urlencode 'match[]={namespace=~".+"}' --data-urlencode since=15m | jq '.data | length'
/loki/api/v1/serieslists the streams that match a selector.namespace=~".+"means any namespace at all.-G --data-urlencode, as in Lesson 1, puts the query in the address, encoded so the braces and quotes survive.
29
Twenty-nine. Remember that number for the Spot the problem.
LogQL
LogQL is Loki's query language, and it reads left to right. First, braces choose streams by label. Here, staging's nginx container:
{namespace="bookshop-staging", container="nginx"}
The newest lines it found:
10.244.1.1 - - [06/Nov/2026:00:22:38 +0000] "GET / HTTP/1.1" 200 7754 "-" "kube-probe/1.35" "-"
10.244.1.33 - - [06/Nov/2026:00:22:34 +0000] "GET / HTTP/1.1" 200 7754 "-" "Blackbox-Exporter/0.29.1" "-"
10.244.1.33 - - [06/Nov/2026:00:22:31 +0000] "GET / HTTP/1.1" 200 7754 "-" "Blackbox-Exporter/0.29.1" "-"
Lines only, so far. To ask questions of them, they need fields. nginx's lines always have the same shape, and pattern describes it:
{namespace="bookshop-staging", container="nginx"}
  | pattern `<ip> - <_> [<_>] "<method> <path> <_>" <status> <size> "<_>" "<agent>" "<_>"`
|passes the lines on to the next step, as in a shell.<name>captures that part of the line as a field calledname;<_>skips a part. Everything else, the spaces, dashes, brackets and quotes, must match the line exactly.- The backticks around the pattern are LogQL's raw string, so the quotes inside don't need escaping.
Now each line has ip, method, path, status, size and agent. Wrap the query in count_over_time and it counts lines instead of returning them; sum by (agent) adds them up per agent, the same as PromQL's sum by:
sum by (agent) (count_over_time({namespace="bookshop-staging", container="nginx"}
  | pattern `<ip> - <_> [<_>] "<method> <path> <_>" <status> <size> "<_>" "<agent>" "<_>"` [10m]))
60  agent=kube-probe/1.35
40  agent=Blackbox-Exporter/0.29.1
20  agent=NGINX-Prometheus-Exporter/v0.0.0-SNAPSHOT-9956da7
Who visits staging, in the last 10 minutes. Every one of them is machinery, and each number checks out against settings from earlier lessons:
- 60 from the kubelet's readiness probe: once every 10 seconds.
- 40 from the blackbox exporter: two checks (Lesson 5's
bookshop-upandbookshop-banner), each every 30 seconds. - 20 from the nginx exporter, Lesson 4's sidecar, reading
/stub_statusevery 30 seconds. (v0.0.0-SNAPSHOTis how its image reports its version: built without a version number stamped in. Logs show details like that.)
Then a visitor, a short-lived pod asking for pages that exist and pages that don't:
kubectl run lesson9-visitor -n bookshop-staging --image=curlimages/curl:8.11.1 --restart=Never --rm -i --quiet -- \
  sh -c 'for p in / /index.html /admin /wp-login.php /books/2026 /admin; do curl -s -o /dev/null -w "%{http_code} $p\n" http://bookshop$p; done'
kubectl run ... --rm -istarts a pod, shows its output, and deletes it when it finishes: a one-off visitor, not something to keep in Git.curl -s -o /dev/null -w "%{http_code} $p\n"asks for each page, throws the page away, and prints only the status code and the path.
200 /
200 /index.html
404 /admin
404 /wp-login.php
404 /books/2026
404 /admin
Four pages that don't exist. Now a filter, after the pattern, keeping only the errors:
{namespace="bookshop-staging", container="nginx"}
  | pattern `<ip> - <_> [<_>] "<method> <path> <_>" <status> <size> "<_>" "<agent>" "<_>"`
  | status >= 400
10.244.1.56 - - [06/Nov/2026:00:22:41 +0000] "GET /admin HTTP/1.1" 404 153 "-" "curl/8.11.1" "-"
10.244.1.56 - - [06/Nov/2026:00:22:41 +0000] "GET /books/2026 HTTP/1.1" 404 153 "-" "curl/8.11.1" "-"
10.244.1.56 - - [06/Nov/2026:00:22:41 +0000] "GET /wp-login.php HTTP/1.1" 404 153 "-" "curl/8.11.1" "-"
10.244.1.56 - - [06/Nov/2026:00:22:41 +0000] "GET /admin HTTP/1.1" 404 153 "-" "curl/8.11.1" "-"
And counted by path:
sum by (status, path) (count_over_time({namespace="bookshop-staging", container="nginx"}
  | pattern `<ip> - <_> [<_>] "<method> <path> <_>" <status> <size> "<_>" "<agent>" "<_>"`
  | status >= 400 [10m]))
2  path=/admin status=404
1  path=/wp-login.php status=404
1  path=/books/2026 status=404
Which pages failed, how often, and for whom. Now the same requests, as Prometheus sees them, from Lesson 4's exporter, with Prometheus's port-forward from Lesson 1:
curl -s -G http://localhost:9090/api/v1/query --data-urlencode 'query=nginx_http_requests_total{namespace="bookshop-staging"}' | jq -c '.data.result[] | [.metric, .value[1]]'
[{"__name__":"nginx_http_requests_total","container":"exporter","endpoint":"metrics","instance":"10.244.1.52:9113","job":"bookshop","namespace":"bookshop-staging","pod":"bookshop-6869cf94c9-5psn2","service":"bookshop"},"390"]
One number: 390 requests, ever, for this pod. No path, no status, no agent. That's the deal each makes. A metric is a few numbers, cheap to keep for months and fast to graph and alert on, but it only knows what it counts. Logs keep every detail, and cost more to store and to search. Metrics tell you a rate of errors went up; the logs tell you it was /wp-login.php, from one address, which is somebody probing for a WordPress login, not a broken shop.
Two more kinds of filter worth knowing:
|= "text"keeps lines containing some text, and!= "text"drops them.{namespace="bookshop-staging", container="nginx"} != "kube-probe"hides the probe's lines. These are the fastest filters: put them first.| jsonpulls the fields out of lines that are JSON, as many programs write, with no pattern to describe.
Loki in Grafana
Loki as a Grafana data source, in the monitoring Application's values, under grafana:
          # Logs, from Loki (Lesson 9), beside Prometheus in Explore and on dashboards.
          additionalDataSources:
            - name: Loki
              type: loki
              uid: loki
              url: http://loki.monitoring.svc:3100
              access: proxy
uid: lokifixes its ID, asprometheusis fixed for Lesson 6's dashboard, so dashboards in Git can name it.access: proxy: Grafana's server talks to Loki, not your browser, which couldn't reach a Service inside the cluster.
Merged as #68. Then Grafana's API, with Grafana's port-forward and the sealed login from Lesson 1, listing its data sources and asking it to test Loki's:
GPW=$(cat .grafana-admin)
curl -s -u admin:"$GPW" http://localhost:3000/api/datasources | jq -r '.[] | "\(.name) \(.type) \(.url)"'
curl -s -u admin:"$GPW" http://localhost:3000/api/datasources/uid/loki/health | jq -c .
Alertmanager alertmanager http://monitoring-kube-prometheus-alertmanager.monitoring:9093/
Loki loki http://loki.monitoring.svc:3100
Prometheus prometheus http://monitoring-kube-prometheus-prometheus.monitoring:9090/
{"message":"Data source successfully connected.","status":"OK"}
In Grafana, Explore, with Loki chosen at the top, the editor switched from Builder to Code, and the error query from above:
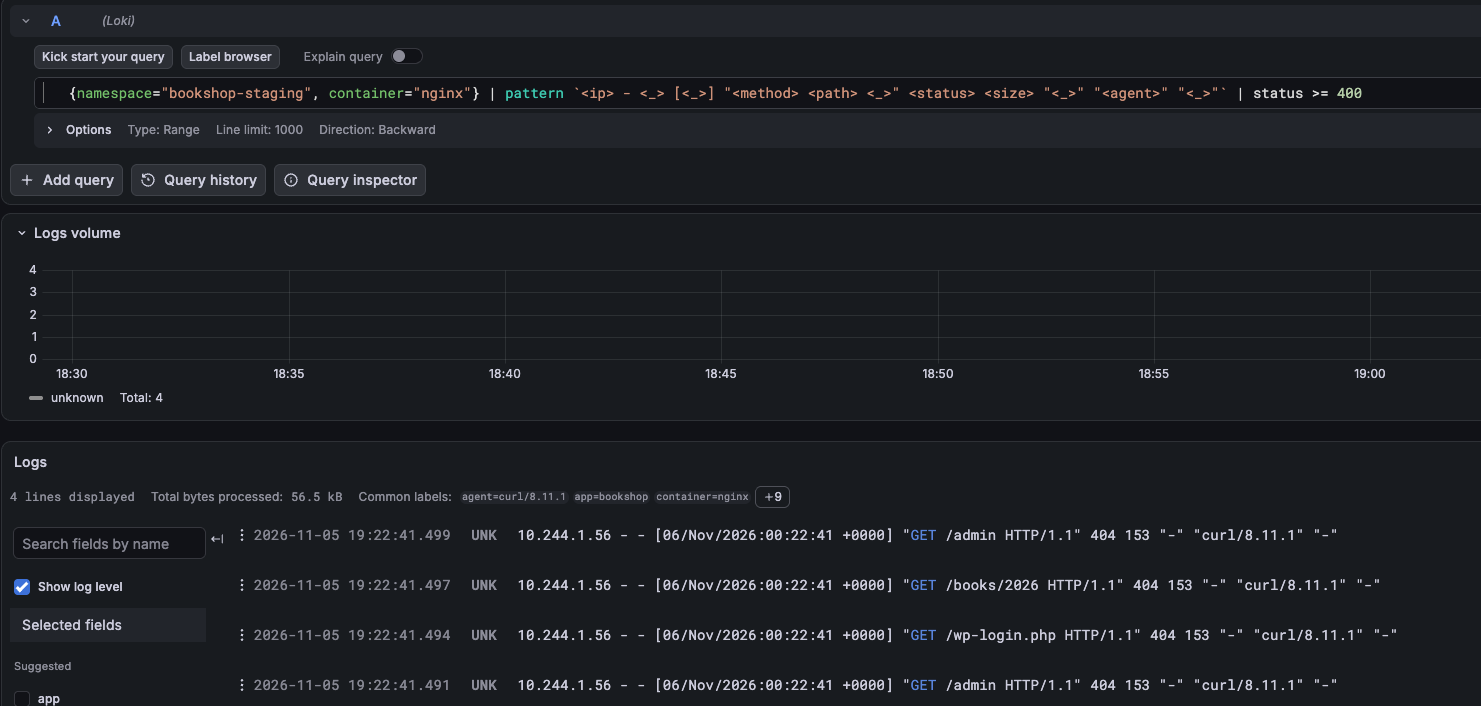
The same four lines. Above them, Grafana graphs how many lines matched over the hour, with a single spike of 4 at 19:22, the visitor's minute (off the right edge of this crop, which keeps the lines readable). Two things the page shows:
- Total bytes processed: 56.5 kB, for four lines. Loki read every line in staging's nginx stream for the hour, then kept the four that matched. That's the cost of indexing only labels: the labels narrow it to a few streams, then Loki reads. Choose streams as tightly as you can.
UNK, andunknownunder the graph: Loki looks for a log level, such aserrororinfo, in each line, and access logs don't have one. Programs that write a level get coloured by it.
Grafana also has Drilldown, then Logs, in its menu: a point-and-click way to browse logs by service, with no LogQL. Handy for a first look; LogQL is what works everywhere, in dashboards, alert rules and other tools.
In real systems
- Store logs in a bucket. Real Loki installs keep their logs in object storage, such as S3 or Google Cloud Storage, which is cheap, and grows without anyone resizing disks. One pod with a filesystem is a single copy: lose the disk, lose the logs.
- Keep labels few, and filter on the rest. Labels for where a log came from, such as namespace, app and container; everything that varies per line, such as path, user or status, found with filters and parsers at query time. The Spot the problem shows why.
- Write logs as JSON, with a level. A program that writes each line as JSON, with a
levelfield, can be searched with| jsonand coloured by level, with no pattern to maintain. - Set retention on purpose. How long logs are kept is a cost decision, and sometimes a legal one: some logs must be kept for a year, and some mustn't be kept at all.
- Keep secrets out of logs. A log line with a password or a card number in it is now in Loki, for 72 hours here, or a year somewhere else. Alloy can drop or mask them before they're sent.
Spot the problem
Work out what's wrong before you read the explanation.
The label that took down logging. A team wants faster searches by page, so they add a rule to Alloy: parse each nginx line and make path a label. It works on their laptop. In production, a week later, Loki is slow, then out of memory, and every query times out. What happened? A label with too many values. Each different set of labels is a separate stream, with its own index entries and its own chunks. This cluster has 29 streams. With path as a label, every different path makes a new stream: every product page, every search, every bot trying /wp-login.php and ten thousand other addresses. Twenty-nine becomes millions, each holding a handful of lines. That's called high cardinality, and it's the most common way to break Loki, and Prometheus too. Paths belong in the line, found with | pattern ... | path = "/admin" when someone asks, exactly as this lesson did. Labels say where a log came from, never what's in it.
Keep this
| To | Use |
|---|---|
| Reach Loki | kubectl port-forward -n monitoring svc/loki 3100:3100 |
| Is it ready | curl localhost:3100/ready |
| Which labels it has | /loki/api/v1/labels, and /loki/api/v1/label/NAME/values |
| How many streams | /loki/api/v1/series with match[] |
| Choose streams | {namespace="NS", container="C"} |
| Keep or drop lines with text | |= "text" and != "text" |
| Pull fields out of a line | | pattern for fixed shapes, | json for JSON |
| Filter on a field | | status >= 400 |
| Count lines | sum by (FIELD) (count_over_time(QUERY [10m])) |
| Check a chart before merging | helm template NAME REPO/CHART --version V -f VALUES |
| Search in Grafana | Explore, Loki, Code |
Where you are now
The cluster has metrics, alerts that reach Slack, and now logs: every pod's lines, kept for 3 days, searchable with LogQL and beside the metrics in Grafana. One gap is left. Every alert so far depends on Prometheus and Alertmanager working. If either stops, nothing fires, and silence looks exactly like everything being fine. The next lesson closes that gap with a dead-man's switch: an alert that's always firing, so that when it stops arriving, someone is told.
Check yourself
What do logs answer that metrics can't?
What does Loki index?
Why did this lesson use Alloy, not Promtail?
In a pattern, what does <_> do?
Prometheus showed 390 for staging's requests. What was missing?
Why not make the request path a Loki label?
Key terms
- Log: the lines a program writes as it works, one per event, such as nginx's one per request.
- Loki: stores logs and answers LogQL queries, indexing only each stream's labels.
- Stream: the lines with one exact set of labels, such as one container's log.
- Grafana Alloy: collects logs, metrics and traces, and sends them on; Promtail's replacement.
- LogQL: Loki's query language: a stream selector in braces, then steps after pipes.
- Parser: a LogQL step that pulls fields out of a line, such as
patternorjson. - Retention: how long logs are kept before they're deleted.
- Cardinality: how many different values a label has. High cardinality means many streams, and a slow Loki.
Go deeper
- The Loki documentation: LogQL (opens in a new tab), and labels, with what makes a good one (opens in a new tab).
- Grafana Alloy (opens in a new tab), and its
loki.source.kubernetes(opens in a new tab) component. - Try: in Explore, show staging's nginx lines without the probes, using
!= "kube-probe". How many lines are left in the last 10 minutes? - Try: count the errors per minute with
sum(count_over_time(... | status >= 400 [1m])), and add it as a panel to Lesson 6's bookshop dashboard, with the Loki data source. - Try: run
kubectl logs -n monitoring deploy/alloy -c alloy | head. Alloy's own lines arekey=valuepairs with alevel=: find them in Explore with{namespace="monitoring", container="alloy"}, and see how Grafana colours them.