By the end you'll know
- Why a dashboard belongs in Git, not only in Grafana
- How Grafana's dashboard sidecar loads dashboards from ConfigMaps
- What a dashboard's JSON looks like: panels, queries, units and colors
- How Kustomize turns a file into a ConfigMap, and the one rule it brings
- What "provisioned" means, and why Grafana won't save an edit to one
- How to change a dashboard through a pull request, without a huge diff
Before you start
- You need: Lesson 5 done, with the Probes passing, and the Argo CD port-forward running, with
argocd logindone. - This lesson changes things:
apps/monitoring/, through two pull requests. - Check where kubectl points:
kubectl config current-contextshould saykind-gitops. - Where commands run: your own computer's terminal, in
gitops-practice, and Grafana in your browser, athttp://localhost:3000with its port-forward running.
The short version
- The problem. A dashboard built by clicking lives only in Grafana's database: no review, no history, and gone if Grafana is.
- The sidecar. A container in Grafana's pod loads every ConfigMap labelled
grafana_dashboard: "1", in any namespace. All 29 of the chart's dashboards arrive that way. - The file.
apps/monitoring/dashboards/bookshop.json: seven panels, from "shop answering" to memory per pod. Kustomize makes it a ConfigMap with that label. - The result. In Grafana 10 seconds after the merge. Marked provisioned: an edit saved through Grafana's own API was refused.
- A change. An eighth panel, through a pull request, in Grafana 10 seconds later. And a 375-line diff, because
jqreformatted the whole file.
Why a dashboard belongs in Git
Grafana's usual way is to build a dashboard by clicking: add a panel, type a query, choose a color, save. The result lives in Grafana's own database. That works for a while. Then someone edits a panel and nobody knows what it said before; or the dashboard everyone uses at 3 a.m. turns out to have been one person's experiment; or Grafana's database goes, as it did every time its pod was replaced in Lesson 1, and the dashboards go with it.
Everything else here is in Git, reviewed through pull requests, and rebuilt from Git in Argo CD Lesson 11. A dashboard is a file too, so it can be the same.
How dashboards get into Grafana
Grafana's pod has three containers:
$ kubectl get deploy -n monitoring monitoring-grafana -o jsonpath='{range .spec.template.spec.containers[*]}{.name}{"\n"}{end}'
grafana-sc-dashboard
grafana-sc-datasources
grafana
grafana, and two sidecars, like the bookshop's exporter in Lesson 4. grafana-sc-dashboard watches the cluster for dashboards. What it looks for:
LABEL=grafana_dashboard
LABEL_VALUE=1
FOLDER=/tmp/dashboards
RESOURCE=both
NAMESPACE=ALL
Any ConfigMap or Secret (RESOURCE=both), in any namespace (NAMESPACE=ALL), labelled grafana_dashboard: "1". It copies each one into /tmp/dashboards, and Grafana loads every dashboard file in that folder. That's where the 29 ready-made dashboards came from:
$ kubectl get configmap -n monitoring -l grafana_dashboard=1 --no-headers | wc -l
      29
29 ConfigMaps, 29 dashboards. A dashboard of your own is one more ConfigMap with that label. And one more thing the dashboard needs: the ID of the Prometheus data source, so its queries know where to go:
$ curl -s -u admin:"$(cat .grafana-admin)" http://localhost:3000/api/datasources | jq -r '.[] | "\(.name)  type=\(.type)  uid=\(.uid)"'
Alertmanager  type=alertmanager  uid=alertmanager
Prometheus  type=prometheus  uid=prometheus
The chart sets a fixed ID, prometheus. Fixed is what matters: Grafana makes up a random one for a data source added by hand, and a dashboard file that names it works on one Grafana and nowhere else.
A dashboard, as a file
A Grafana dashboard is a JSON file. Its outline:
{
  "uid": "bookshop",
  "title": "Bookshop",
  "description": "The bookshop, from the inside and the outside (Monitoring track, Lesson 6). Kept in Git: change it there.",
  "tags": ["bookshop", "kwamib.dev"],
  "schemaVersion": 39,
  "version": 1,
  "refresh": "30s",
  "time": { "from": "now-1h", "to": "now" },
  "panels": [ ... ]
}
uid: the dashboard's permanent ID, and its web address:/d/bookshop. Choose it yourself, so links to it never break.refreshandtime: reload every 30 seconds, and show the last hour.panels: the boxes on the page.
One panel, the first:
{
  "id": 1, "type": "stat", "title": "Shop answering",
  "description": "The blackbox check: does the page answer with a 2xx?",
  "gridPos": { "x": 0, "y": 0, "w": 6, "h": 5 },
  "datasource": { "type": "prometheus", "uid": "prometheus" },
  "targets": [ { "refId": "A", "expr": "probe_success{job=\"bookshop-up\", instance=~\".*svc/$\"}", "legendFormat": "{{instance}}" } ],
  "fieldConfig": { "defaults": {
    "mappings": [ { "type": "value", "options": { "0": { "text": "DOWN", "color": "red" }, "1": { "text": "UP", "color": "green" } } } ],
    "color": { "mode": "thresholds" },
    "thresholds": { "mode": "absolute", "steps": [ { "color": "red", "value": null }, { "color": "green", "value": 1 } ] }
  }, "overrides": [] },
  "options": { "reduceOptions": { "calcs": ["lastNotNull"] }, "colorMode": "background", "textMode": "value_and_name" }
}
type: stat: one big number per series.timeseriesis a line graph.gridPos: where it sits. The page is 24 units wide, sow: 6is a quarter.targets: the PromQL, Lesson 5's probes, leaving out the missing page withinstance=~".*svc/$"(ends insvc/).legendFormatlabels each series with itsinstance.mappings: show 1 as UP and 0 as DOWN, instead of the number.thresholds: red below 1, green at 1.calcs: lastNotNull: show the latest value.
The seven panels, in order:
$ jq -r '.panels[] | "\(.id). \(.type): \(.title)"' apps/monitoring/dashboards/bookshop.json
1. stat: Shop answering
2. stat: Page says the right thing
3. stat: Production, right, last 24 hours
4. stat: Pods available
5. timeseries: Requests per second
6. timeseries: Response time, from the outside
7. timeseries: Memory per pod
Across the top, four answers: is it up, is it right, how reliably, how many pods. Below, three graphs. Every query is from Lessons 3 to 5. Two details worth copying:
- "Requests per second" uses
rate(...[$__rate_interval]).$__rate_intervalis Grafana's: it picks a window long enough for the scrape interval and the time range shown, so the rate never comes back empty, the trap from Lesson 3. - "Production, right, last 24 hours" uses
percentunit, and turns orange below 99% and red below 99.9%. Those lines are a decision about what's good enough, written down.
Each panel's description says what it measures, and appears when you hover over the panel's title. Someone looking at the dashboard during an incident shouldn't have to guess what a number means.
Kustomize: turning the file into a ConfigMap
The sidecar wants a ConfigMap, and the dashboard is a JSON file. Pasting the file into a ConfigMap by hand means two copies to keep in step. Kustomize, built into kubectl, makes the ConfigMap from the file instead. A kustomization.yaml in the folder says how:
# Monitoring's own files (Monitoring track), put together by Kustomize (Lesson 6).
# Every file in this folder that should be applied is listed here: one left out is deleted.
apiVersion: kustomize.config.k8s.io/v1beta1
kind: Kustomization
resources:
  - grafana-admin.yaml
  - bookshop-probes.yaml
configMapGenerator:
  # Each dashboard file becomes a ConfigMap with the label Grafana's dashboard sidecar looks for.
  - name: grafana-dashboard-bookshop
    files:
      - dashboards/bookshop.json
    options:
      disableNameSuffixHash: true
      labels:
        grafana_dashboard: "1"
resources: the plain YAML files already in this folder, as they are.configMapGenerator: make a ConfigMap calledgrafana-dashboard-bookshop, holdingdashboards/bookshop.json, with the sidecar's label.disableNameSuffixHash: Kustomize normally adds a fingerprint to a generated ConfigMap's name, so a change makes a new one. For the sidecar, one stable name is simpler.
The rule Kustomize brings, and the comment at the top says it: once a folder has a kustomization.yaml, Argo CD applies only what it lists. Before, Argo CD applied every YAML file in the folder. A file in the folder but not in the list would now be left out, and, with prune on, deleted from the cluster. Here, that would have been Grafana's sealed login. So check what Kustomize builds before merging:
kubectl kustomize apps/monitoring | grep -e '^kind:' -e '^ name:' | paste - - | sort
kind: ConfigMap	  name: grafana-dashboard-bookshop
kind: Probe	  name: bookshop-banner
kind: Probe	  name: bookshop-up
kind: SealedSecret	  name: grafana-admin
kubectl kustomize builds the result without applying it. grep keeps each resource's kind and name, and paste - - joins each pair onto one line. Four resources: the new ConfigMap, and all three that were there before. Then the pull request, for the JSON file and the kustomization together:
merged: 2a45db0 Monitoring: a Grafana dashboard for the bookshop, from Git (#48)
Synced Healthy 2a45db03ad84b72

$ argocd app get monitoring-config -o json | jq -r '.status.sourceType'
Kustomize

configmap/grafana-dashboard-bookshop                                     1      6s
Argo CD noticed the kustomization.yaml and switched monitoring-config to Kustomize by itself (sourceType). The sealed login and the Probes were still there, unchanged: 8 hours and 92 minutes old.
Grafana finds it
the dashboard was in Grafana after about 10s

$ kubectl logs -n monitoring deploy/monitoring-grafana -c grafana-sc-dashboard --since=5m | grep -i bookshop
{"time": "2026-11-05T20:20:18.621304+00:00", "level": "INFO", "msg": "Writing /tmp/dashboards/bookshop.json (ascii)"}

$ curl -s -u admin:"$(cat .grafana-admin)" "http://localhost:3000/api/search?query=Bookshop&type=dash-db" | jq -r '.[] | "\(.title)  uid=\(.uid)  url=\(.url)"'
Bookshop  uid=bookshop  url=/d/bookshop/bookshop
In Grafana 10 seconds after the ConfigMap appeared. The sidecar saw it, wrote the file, and Grafana loaded it. Open http://localhost:3000/d/bookshop:
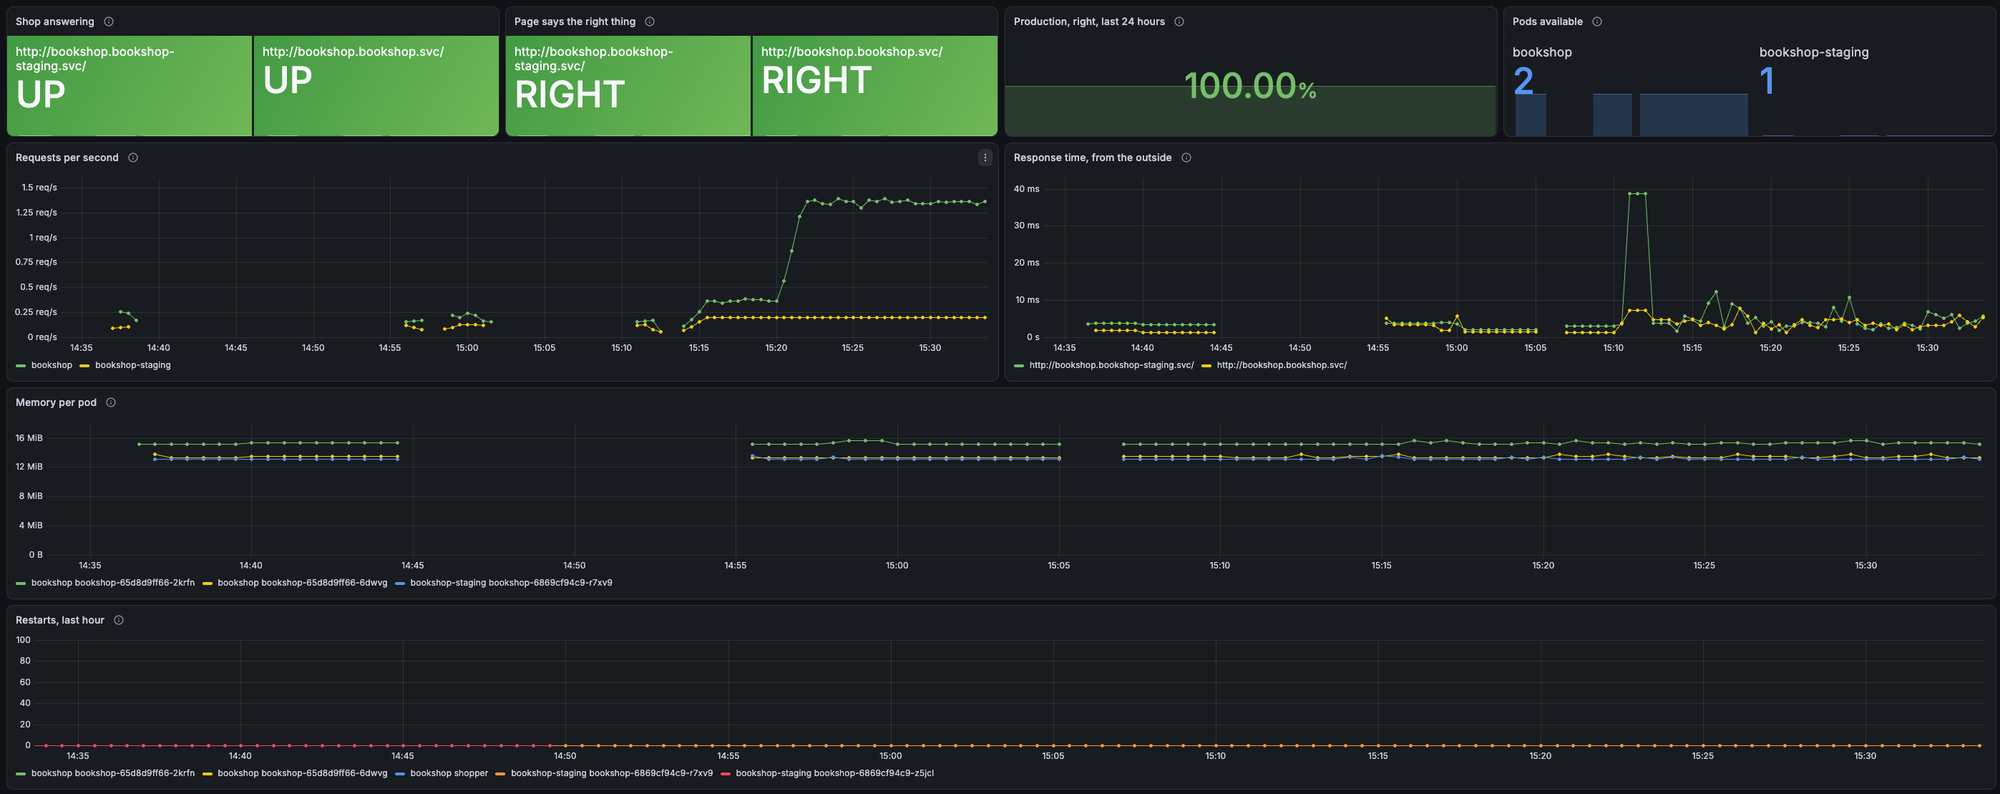
The top row answers at a glance: both environments UP, both pages RIGHT, production right 100% of the last 24 hours, 2 pods and 1. Below, three things worth reading in the graphs:
- Requests per second climbs at 15:20, to about 1.4 a second in production: the test pod, visiting once a second, starting. Before that it sat at about 0.37: Lesson 4's 0.27 baseline, plus Lesson 5's blackbox checks, three addresses every 30 seconds, which are requests too. Staging, with one pod and two checks, sits just above 0.2.
- The gaps are times the laptop was asleep, with nothing scraped, as in Lesson 3. Look at where each graph comes back: memory, a gauge, picks up straight away; requests, a
rate(), starts again a few minutes later, once its window holds enough samples. - The response time spike to 40 milliseconds, right after the gap at 15:10: the first checks after waking up were slow, then settled back to a few milliseconds.
And one panel's shape needs a tweak: with every restart count at 0, Grafana draws "Restarts" from 0 to 100, which looks like there's room for trouble that isn't there. A softMax of 5 in the panel's settings would fix the scale. It also lists the test pod, shopper, because it's in the bookshop namespace too.
The panels' queries, run through Grafana's own query API, the way the dashboard runs them:
through Grafana: probe_success{job="bookshop-up", instance=~".*svc/$"}
instance=http://bookshop.bookshop-staging.svc/ job=bookshop-up  1
instance=http://bookshop.bookshop.svc/ job=bookshop-up  1

through Grafana: kube_deployment_status_replicas_available{deployment="bookshop"}
namespace=bookshop-staging  1
namespace=bookshop  2

through Grafana: sum by (namespace) (rate(nginx_http_requests_total{job="bookshop"}[2m]))
namespace=bookshop  0.7111116050260631
namespace=bookshop-staging  0.20000222224691383
Both environments up, 2 pods and 1, and requests rising, from a pod visiting the shop once a second. (Labels trimmed.)
Editing it in Grafana
Grafana's interface still has a Save button. What happens to an edit?
$ curl -s -u admin:"$(cat .grafana-admin)" http://localhost:3000/api/dashboards/uid/bookshop | jq '{title: .dashboard.title, version: .dashboard.version, panels: (.dashboard.panels | length), provisioned: .meta.provisioned, canSave: .meta.canSave}'
{
  "title": "Bookshop",
  "version": 1,
  "panels": 7,
  "provisioned": true,
  "canSave": true
}
provisioned: true: it came from a file, not from someone saving it in Grafana. And canSave: true, which suggests it can be saved. Trying it, through the same API the Save button uses, with a new title:
$ ... | jq '{dashboard: (.dashboard | .title = "Bookshop (edited in Grafana)"), overwrite: true}' \
      | curl -s -u admin:"$(cat .grafana-admin)" -X POST http://localhost:3000/api/dashboards/db \
        -H 'Content-Type: application/json' -d @- | jq .
{
  "message": "Cannot save provisioned dashboard"
}

$ ... | jq -r '.dashboard.title'
Bookshop
Refused, and the title unchanged. Whatever canSave says, a provisioned dashboard can only change where it came from. In the interface, you can still edit panels to try things out; Grafana offers to copy the JSON or save a copy under a new name, and the real one stays as Git says. That's self-heal, Grafana's way: the file is the truth.
Changing it in Git
So a change is a pull request. An eighth panel, restarts in the last hour, at the bottom:
{
  "id": 8, "type": "timeseries", "title": "Restarts, last hour",
  "description": "Containers restarted in the last hour, per pod. Anything above 0 is worth a look.",
  "gridPos": { "x": 0, "y": 22, "w": 24, "h": 7 },
  "targets": [ { "refId": "A", "expr": "sum by (namespace, pod) (increase(kube_pod_container_status_restarts_total{namespace=~\"bookshop|bookshop-staging\"}[1h]))", "legendFormat": "{{namespace}} {{pod}}" } ],
  ...
}
increase of the restart counter, from Lesson 3, per pod. And version raised from 1 to 2, so Grafana knows it's a new version. The pull request:
$ git diff --stat
 apps/monitoring/dashboards/bookshop.json | 432 +++++++++++++++++++++++++++----
 1 file changed, 375 insertions(+), 57 deletions(-)

merged: 4c068ed Monitoring: a restarts panel on the bookshop dashboard (#49)

Grafana had the new panel after about 10s

{
  "title": "Bookshop",
  "version": 2,
  "panels": 8
}
Version 2, eight panels, 10 seconds after the merge. But look at the diff: 375 lines added and 57 removed, for one panel. The panel was added with jq, and jq writes JSON in its own layout, every { } opened out across several lines. The original file was written with several things on a line. So nearly every line changed, and a reviewer can't see the one change that matters. More on that in Spot the problem.
In real systems
- Apps can bring their own dashboards. The sidecar reads every namespace here, so the bookshop's Helm chart could include its dashboard as a ConfigMap, released with the app. Teams often do: the people who know the app write its dashboard.
- Build in Grafana, keep in Git. Writing JSON by hand is slow. The usual way is to build or change a dashboard in Grafana's interface, then Export, Export as JSON, and commit that file, by pull request.
- Dashboards as code. Tools like Grafonnet, Grafana's library for Jsonnet, or the Grafana Terraform provider generate dashboard JSON from shorter code, and make many similar dashboards from one template.
- Fewer, better dashboards. One dashboard per service that answers "is it working, and if not, where?" beats twenty nobody understands. The top row of this one is that question.
Spot the problem
Work out what's wrong before you read the explanation.
The diff nobody could read. Someone exports a dashboard from Grafana, changes one query in a text editor, saves, and opens a pull request. The diff is 400 lines. The reviewer, faced with 400 changed lines, approves it without reading. The next week, a panel that was showing errors is found to show nothing at all: the "one query" change had also quietly removed a filter in another panel, buried in the 400 lines. What went wrong? The file's formatting changed along with its content. Grafana's export, a text editor, and jq each lay JSON out their own way, so passing a file through any of them can rewrite every line. That's what happened here too: jq turned a one-panel change into 375 lines. The fix is to always format the file the same way before committing. For example, run jq --indent 2 . FILE > FILE.tmp && mv FILE.tmp FILE on every dashboard, every time, and even check it automatically in CI. Then the first big reformat happens once, on its own, and every pull request after it shows only what changed. A diff someone can read is a diff someone will actually review.
Keep this
| To | Use |
|---|---|
| See what the sidecar looks for | kubectl get deploy -n monitoring monitoring-grafana -o json, the grafana-sc-dashboard container's env |
| Find a data source's ID | curl -s -u admin:PW localhost:3000/api/datasources | jq '.[] | .uid' |
| Make a ConfigMap from a file | configMapGenerator in kustomization.yaml, with the sidecar's label |
| See what Kustomize builds | kubectl kustomize FOLDER |
| List what it builds | kubectl kustomize FOLDER | grep -e '^kind:' -e '^ name:' | paste - - |
| Find a dashboard | curl -s -u admin:PW 'localhost:3000/api/search?query=NAME&type=dash-db' |
| Check it's from a file | .../api/dashboards/uid/UID | jq .meta.provisioned |
| A rate that's never empty | rate(NAME[$__rate_interval]), in Grafana |
| Show 1 and 0 as words | mappings, in the panel's fieldConfig |
| Keep diffs small | jq --indent 2 . FILE, the same way every time |
| Change a dashboard | Edit the JSON, raise version, pull request |
Where you are now
The bookshop has a dashboard: up, right, how reliably, how busy, how fast, how much memory, how many restarts, kept in Git and back in 10 seconds after any change. Someone has to look at it, though. Lesson 7 writes alert rules, so that when the top row turns red, Prometheus notices before a person has to.
Check yourself
How did the bookshop dashboard get into Grafana?
Why does the dashboard name its data source by a fixed uid?
What does the kustomization.yaml rule mean for files left off its list?
Saving an edit to the dashboard through Grafana's API returned what?
Why was adding one panel a 375-line diff?
What does $__rate_interval do in a Grafana query?
Key terms
- Dashboard: a page of panels in Grafana, stored as JSON.
- Panel: one box on a dashboard: a query, and how to show it.
- Provisioned: loaded from a file rather than saved in Grafana, so it can only be changed at the source.
- Dashboard sidecar: the container in Grafana's pod that loads labelled ConfigMaps as dashboards.
- Data source: where Grafana gets numbers from, such as Prometheus, with a
uiddashboards refer to. - Kustomize: a tool built into kubectl that builds YAML from parts, such as a ConfigMap from a file.
- configMapGenerator: Kustomize's way of making a ConfigMap from files.
$__rate_interval: Grafana's choice of window forrate(), safe for the scrape interval.
Go deeper
- Grafana's documentation: dashboard JSON model (opens in a new tab) and provisioning (opens in a new tab), and Kustomize's configMapGenerator (opens in a new tab).
- Try: format the dashboard file once with
jq --indent 2, commit that by itself, then change one panel's title. How big is the diff now? - Try: in Grafana, open the dashboard, edit a panel, and choose Save. What does Grafana offer, and does the version in Git change?