By the end you'll know
- Why monitoring can't tell you it has stopped
- What Watchdog is, and how to send it to an outside check as a heartbeat
- How a heartbeat check decides something is down, and how long that takes
- Why the heartbeat must never send a "resolved" message
- What an OOMKilled crash loop looks like
- Why reverting a StatefulSet's broken template isn't always enough
Before you start
- You need: Lesson 8 done, with
amtool, and the Argo CD port-forward running, withargocd logindone. - You need a free Healthchecks.io (opens in a new tab) account. Its free Hobbyist plan covers 20 checks.
- This lesson changes things: four pull requests, including Prometheus broken on purpose and put back.
- Check where kubectl points:
kubectl config current-contextshould saykind-gitops.
The short version
- The gap. Every alert so far comes from Prometheus, through Alertmanager. If either stops, nothing fires, and nobody is told.
- The switch. Watchdog, an alert that's always firing, sent to a Healthchecks.io check every couple of minutes. When the pings stop, Healthchecks.io, outside the cluster, says the check is down.
- The break. Prometheus given 40 MiB of memory, and killed every time it started. The last ping came 3 minutes later; Healthchecks.io said down 6 minutes after the merge.
- The fix that wasn't. The revert merged, and Prometheus kept crash-looping for 12 more minutes. The StatefulSet won't replace a pod that never became ready; deleting the pod did it, and the heartbeat said up about 25 seconds later.
The alarm can't report its own death
Lesson 8's alerts reach Slack. Each one starts in Prometheus, which evaluates the rules, and passes through Alertmanager, which sends it. Now imagine Prometheus stops. No rules are evaluated, no alerts fire, Slack stays quiet. Quiet is also what Slack looks like when everything is fine.
This isn't hypothetical. It happened on a cluster of mine: Prometheus stuck in a crash loop for 9 days, restarting over two thousand times, and not one alert, because the thing that would have sent it was the thing that was down. Every alert depends on the alerting working; none can tell you when it isn't.
The answer is older than computers. A train's dead-man's switch is a pedal the driver must keep pressing; if they stop, the train brakes by itself. For monitoring: the system checks in with something outside it, on a schedule, and a missed check-in is the alarm. Outside matters. Anything inside the cluster goes down with it.
Watchdog, the heartbeat
kube-prometheus-stack already has the always-on part. Its rules include Watchdog, whose expression is just vector(1): always true, so always firing, for as long as Prometheus is running rules and reaching Alertmanager. It's been in every am_alerts list since Lesson 8, sent to null:
active Watchdog receivers=null
The other half is a service outside the cluster that expects to hear from it. Healthchecks.io does exactly this: each check has an address to ping, a period it expects pings within, and a grace time on top; if no ping arrives in time, it marks the check down and notifies you. Its free plan is enough. (Dead Man's Snitch, Cronitor and PagerDuty do the same.)
The check
In Healthchecks.io:
- A project of its own,
gitops-practice, so practice alerts don't mix with real ones, and an API key for it can only see this check. - A check,
gitops-practice monitoring, with Period 1 minute and Grace Time 2 minutes: down after 3 minutes without a ping. - Email on, in the project's Integrations.
- A read-only API key, under the project's Settings, then API Access, then Show API Keys. For checking the check's status from a terminal; it can't change anything.
Two values to keep out of Git: the check's ping URL, https://hc-ping.com/ and a 36-character ID, which works like a password (anyone with it can send pings, and fake pings would keep the check looking up during a real outage); and the API key. Saving them is where this lesson went wrong three times: copying the command to run it replaces whatever you'd copied before. This version waits for you before it reads the clipboard:
read "?Step 1: copy the PING URL in Healthchecks.io, come back, press Enter " && pbpaste | tr -d '\r\n ' > .healthchecks-ping
read "?Step 2: copy the READ-ONLY API KEY in Healthchecks.io, come back, press Enter " && pbpaste | tr -d '\r\n ' > .healthchecks-api
chmod 600 .healthchecks-ping .healthchecks-api
for f in .healthchecks-ping .healthchecks-api; do printf '%-20s %3s chars, starts "%s"\n' "$f" "$(wc -c < $f | tr -d ' ')" "$(cut -c1-6 $f)"; done
read "?..."prints the message and waits for Enter: that pause is when you go to the browser and copy. Only after Enter doespbpasteread the clipboard.tr -d '\r\n 'removes any stray spaces or line breaks that came with the copy.- The last line shows each file's size and first six characters: 56 and
https:for the ping URL, 32 and something else for the key. Enough to know you saved the right thing, without showing it.
Both go in .gitignore, like .slack-webhook. With the key, Healthchecks.io's API shows the check:
curl -s -H "X-Api-Key: $(cat .healthchecks-api)" https://healthchecks.io/api/v3/checks/ | jq '.checks[] | {name, status, timeout, grace, n_pings, last_ping}'
X-Api-Keyis the header Healthchecks.io reads the key from;/api/v3/checks/lists the project's checks.timeoutis the period, andgracethe grace time, both in seconds.
The ping address, sealed
Exactly as the Slack address in Lesson 8: a Secret with one key, url, sealed into apps/monitoring/alertmanager-heartbeat.yaml, and the file added to kustomization.yaml.
kubectl create secret generic alertmanager-heartbeat -n monitoring \
  --from-file=url=.healthchecks-ping --dry-run=client -o yaml | kubeseal -o yaml \
  > apps/monitoring/alertmanager-heartbeat.yaml
$ grep -c hc-ping.com apps/monitoring/alertmanager-heartbeat.yaml
0
Merged as #69:
NAME                                              STATUS   SYNCED   AGE
sealedsecret.bitnami.com/alertmanager-heartbeat            True     5s

NAME                            TYPE     DATA   AGE
secret/alertmanager-heartbeat   Opaque   1      5s
Watchdog, to the heartbeat
Three changes in the monitoring Application's values. The Secret, mounted beside Slack's:
          alertmanagerSpec:
            secrets:
              - alertmanager-slack
              - alertmanager-heartbeat
A route of its own for Watchdog, first in the list, and InfoInhibitor left going nowhere:
              routes:
                # Watchdog fires all the time Prometheus and Alertmanager are working: send it to the
                # outside check every minute. When the pings stop, the check says so (Lesson 10).
                - receiver: heartbeat
                  matchers: ['alertname = "Watchdog"']
                  group_wait: 0s
                  group_interval: 1m
                  repeat_interval: 1m
                # InfoInhibitor is machinery: nobody needs a message.
                - receiver: "null"
                  matchers: ['alertname = "InfoInhibitor"']
And the receiver:
              - name: heartbeat
                # The ping address is a secret too: read from a file, mounted from the sealed Secret.
                webhook_configs:
                  - url_file: /etc/alertmanager/secrets/alertmanager-heartbeat/url
                    send_resolved: false
- The timers are the point. Everywhere else,
repeat_interval: 4hstops Alertmanager repeating itself. Here, repeating is the job: a reminder every minute is a heartbeat every minute.group_wait: 0ssends the first one straight away. url_file: the address read from the mounted file, like Slack'sapi_url_file. A webhook's settings never hold it.send_resolved: falsematters more than it looks. When Prometheus dies, Watchdog ends, and Alertmanager would send a "resolved" message for it. To Healthchecks.io, any message to the address is a ping: a resolved message would say "alive" at the exact moment it isn't.
Checked with amtool before merging:
$ amtool check-config /tmp/am-config.yaml
Checking '/tmp/am-config.yaml'  SUCCESS
...
 - 3 receivers

$ amtool config routes test --config.file=/tmp/am-config.yaml alertname=Watchdog severity=none
heartbeat

$ amtool config routes test --config.file=/tmp/am-config.yaml alertname=InfoInhibitor severity=none
null

$ amtool config routes test --config.file=/tmp/am-config.yaml alertname=BookshopDown severity=critical
bookshop-team
Watchdog to the heartbeat, and nothing else moved. Merged as #70, and Alertmanager's settings once it loaded them:
- name: heartbeat
  labels:
    name: heartbeat
  webhook_configs:
  - send_resolved: false
    http_config:
      follow_redirects: true
      enable_http2: true
    url_file: /etc/alertmanager/secrets/alertmanager-heartbeat/url
    max_alerts: 0
A path, not an address. And the check, a minute later:
{
  "name": "gitops-practice monitoring",
  "status": "up",
  "timeout": 60,
  "grace": 120,
  "n_pings": 2,
  "last_ping": "2026-11-06T01:08:21+00:00"
}
Up. Then three minutes, to see the pace:
pings in 3 minutes: Healthchecks.io counted 1, Alertmanager sent 1 webhook messages
One in three minutes, not three. The check's log, further down, shows pings every 2 minutes, all evening. Alertmanager only looks at repeat_interval when a group_interval tick comes round; with both at a minute, "a minute since the last message" is a fraction short at each tick, and waits for the next. It's safe here, because the check allows 3 minutes. But a heartbeat check's period should allow for at least two of the sender's intervals: here, a 2-minute period would match what actually happens.
Prometheus, broken on purpose
What happened to that cluster of mine, on purpose: far too little memory, so Prometheus is killed as it starts. In the monitoring Application's values:
        # Lesson 10's break: far too little memory, so Prometheus is killed as it starts.
        prometheus:
          prometheusSpec:
            resources:
              limits:
                memory: 40Mi
Merged at 20:11:36, as #71. Thirty-five seconds later:
NAME                                                 READY   STATUS    RESTARTS     AGE
prometheus-monitoring-kube-prometheus-prometheus-0   2/2     Running   1 (4s ago)   17s
{"restartCount":1,"lastState":"OOMKilled","exitCode":137,"waiting":null}
OOMKilled, exit code 137. OOM is out of memory: Prometheus went past its 40 MiB, and the kernel killed it. 137 is 128 plus 9, the signal number of SIGKILL, the kill that can't be caught. Kubernetes restarts it, it reads its saved data back into memory, passes 40 MiB again, and is killed again: a crash loop. Five minutes in, Kubernetes waiting longer between each try:
NAME                                                 READY   STATUS             RESTARTS        AGE
prometheus-monitoring-kube-prometheus-prometheus-0   1/2     CrashLoopBackOff   5 (2m11s ago)   5m43s
And here is the whole problem, in the alerts Alertmanager had, counted by name:
curl -s http://localhost:9093/api/v2/alerts | jq -r '.[] | "\(.status.state) \(.labels.alertname)"' | sort | uniq -c
It printed nothing at all. No alerts. No Watchdog, no TargetDown, nothing about Prometheus being down, because Prometheus is the thing that would say so. Slack got nothing. If the bookshop had gone down too, Slack would have got nothing about that either.
What the heartbeat saw, minute by minute:
| Time | What happened |
|---|---|
| 20:11:36 | The break merged |
| 20:12:11 | Prometheus OOMKilled, its first restart |
| 20:14:21 | The last ping: Alertmanager still had Watchdog |
| 20:15:15 | Watchdog's endsAt: Alertmanager lets it go |
| 20:16:18 | Watchdog gone from Alertmanager, 282 seconds after the merge |
| 20:17:36 | Healthchecks.io says down, 360 seconds after the merge, and emails |
Why it took a few minutes: Prometheus doesn't send an alert once. It resends firing alerts, each with an endsAt a few minutes ahead, so Alertmanager can tell "still firing" from "nobody's said anything lately". Watchdog's last update before the break said 20:15:15; Alertmanager kept it, and kept pinging, until then. After the last ping at 20:14:21, Healthchecks.io waited its period and grace, 3 minutes, and said down at 20:17:36. Six minutes, against 9 days.
The revert that didn't fix it
The revert merged at 20:17:37, as #72. The script then waited for Prometheus to be ready, and kubectl wait gave up after 5 minutes:
error: timed out waiting for the condition
Ten minutes after the revert:
NAME                                                 READY   STATUS    RESTARTS        AGE
prometheus-monitoring-kube-prometheus-prometheus-0   1/2     Running   7 (9m38s ago)   15m
Fifteen minutes old: the same pod, made from the broken settings at 20:12, still crash-looping. (The script printed "Prometheus Ready" at this point, which was wrong: it didn't check whether the wait had worked. A check that reports success without checking is worse than none.)
Prometheus runs as a StatefulSet, which keeps each version of its pod template as a ControllerRevision. Afterwards:
NAME                                                          CONTROLLER                                                          REVISION   AGE
prometheus-monitoring-kube-prometheus-prometheus-6b6fd4d45    statefulset.apps/prometheus-monitoring-kube-prometheus-prometheus   3          23h
prometheus-monitoring-kube-prometheus-prometheus-86c64d979b   statefulset.apps/prometheus-monitoring-kube-prometheus-prometheus   2          26m
86c64d979b, revision 2, 26 minutes old: the broken template, from the break.6b6fd4d45, revision 3, 23 hours old: the original template. The revert made the template identical to the original, so Kubernetes reused that revision and gave it the next number, instead of making a new one.
So the StatefulSet knew which template it wanted. It just wouldn't use it. With a rolling update, a StatefulSet replaces pods one at a time and waits for each to be ready before going on; when a pod never becomes ready, the rollout stops, and stays stopped even after the template is fixed. The Kubernetes documentation calls the way out a forced rollback: revert the template, then delete the stuck pod by hand.
kubectl delete pod prometheus-monitoring-kube-prometheus-prometheus-0 -n monitoring
The StatefulSet made a new one at once, from the right template:
prometheus-monitoring-kube-prometheus-prometheus-0 2/2 Running 0 26s
current=prometheus-monitoring-kube-prometheus-prometheus-6b6fd4d45 update=prometheus-monitoring-kube-prometheus-prometheus-6b6fd4d45
currentRevisionis the template the pods run;updateRevisionthe one the StatefulSet wants. The same, so the rollout is finished.
And within seconds of the new pod starting, Watchdog was firing again, and the check said so:
20:29:55 after 124s: Healthchecks.io says up
{
  "name": "gitops-practice monitoring",
  "status": "up",
  "timeout": 60,
  "grace": 120,
  "n_pings": 6,
  "last_ping": "2026-11-06T01:29:45+00:00"
}
Twelve minutes of "fixed in Git" while nothing was fixed. Without the heartbeat, the revert would have looked like the end of it. The check's log, for the whole evening:
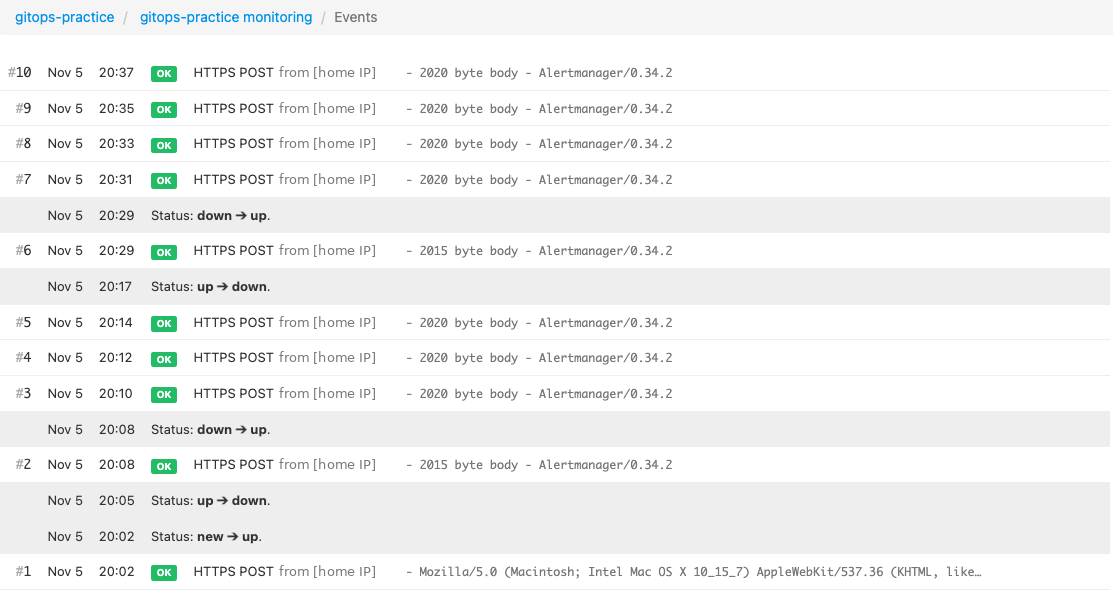
Read it from the bottom:
- #1 at 20:02, from a web browser on the laptop, while setting the check up. Any request to the ping URL counts, from anything. That's how the check went from new to up before Alertmanager knew about it, then down at 20:05, three minutes later, with nothing sending yet: a false alarm, and an email. Set a check up just before its sender, or pause it until then.
- #2 at 20:08, Alertmanager's first ping, and up. Then a ping every 2 minutes, each
HTTPS POSTwith a body of about 2,000 bytes, the Watchdog notification as JSON, fromAlertmanager/0.34.2. - Down at 20:17, nothing until 20:29, the outage and the stuck revert, then up, and every 2 minutes again.
(The address each ping came from is masked here: it's the public address of the network the laptop is on.)
In real systems
- Every alerting system needs one. Prometheus and Alertmanager both have to work for any alert to arrive, so the heartbeat is the one alert that covers both. It's usually the first thing to add, not the last.
- The heartbeat service must be outside. A different provider, network and failure domain from what it watches. A heartbeat checker in the same cluster goes down with it.
- Page on it. A missed heartbeat means every other alert might be missing too. In production it goes to the pager, PagerDuty or similar, not only email.
- Use the same idea for jobs. A backup or a weekly report that pings when it finishes, so a job that never ran raises an alarm. The job that never ran is the failure no error message reports.
- After a fix, check it fixed. A revert is a change to what you want, not proof of what you have. Watch the thing recover: here, the heartbeat coming back was the proof.
Spot the problem
Work out what's wrong before you read the explanation.
The rollback that rolled back nothing. A release sets a memory limit too low on a database's StatefulSet, and its one pod crash-loops. The team reverts the change in Git; Argo CD shows Synced, with the revert's commit. Everyone relaxes. An hour later, the database is still down. What went wrong? The StatefulSet stopped its rollout at the broken pod, and reverting the template didn't restart it. A StatefulSet rolling out a new template replaces pods one at a time, and waits for each to become ready before the next. The broken pod never became ready, so the rollout stopped there; then the template was fixed, but the StatefulSet was still waiting for the broken pod, which would never be ready. Kubernetes's documented answer, the forced rollback, is to delete the stuck pod after reverting, as this lesson did at 20:29. Two habits catch it: after a revert, check the pods, not only Git (the pod's age said it all: 15 minutes old, from before the revert), and have something outside that notices, like the heartbeat that stayed down until the fix was real.
Keep this
| To | Use |
|---|---|
| The always-firing alert | Watchdog, in kube-prometheus-stack's default rules |
| Send it as a heartbeat | A route with group_wait: 0s, group_interval: 1m, repeat_interval: 1m |
| Keep the ping address out of Git | url_file, from a mounted sealed Secret |
| Never ping on the way down | send_resolved: false |
| A heartbeat check's period | At least two of the sender's intervals |
| A check's status, from a terminal | curl -H "X-Api-Key: KEY" https://healthchecks.io/api/v3/checks/ |
| Why a container restarted | .status.containerStatuses[].lastState.terminated.reason, such as OOMKilled |
| A StatefulSet's template versions | kubectl get controllerrevisions |
| Is its rollout finished | .status.currentRevision equals .status.updateRevision |
| A rollout stuck on a broken pod | Revert the template, then kubectl delete pod: a forced rollback |
Where you are now
The monitoring watches the cluster, and something outside watches the monitoring: if Prometheus or Alertmanager stops, Healthchecks.io says so within minutes. That's every piece of the track: metrics, checks from outside, dashboards, alert rules, routing to Slack, logs and a heartbeat. The last lesson uses all of them together, the way they're used for real: an incident, from the first alert to the fix, and what's written afterwards.
Check yourself
Why can't Prometheus alert that Prometheus is down?
What makes Watchdog useful as a heartbeat?
Why send_resolved: false on the heartbeat?
Pings came every 2 minutes, not every 1. Why?
What did exit code 137 with OOMKilled mean?
After the revert, why was Prometheus still crash-looping?
Key terms
- Dead-man's switch: an alarm that goes off when an expected signal stops, rather than when a bad one arrives.
- Heartbeat: a regular "still alive" signal, here a ping from Alertmanager.
- Watchdog: kube-prometheus-stack's always-firing alert, there to be the heartbeat.
- Period and grace time: how often a heartbeat check expects a ping, and how much longer it waits before saying down.
- OOMKilled: a container killed for going over its memory limit; exit code 137.
- Crash loop: a container that keeps failing and being restarted, with longer waits between tries (CrashLoopBackOff).
- ControllerRevision: a saved version of a StatefulSet's pod template.
- Forced rollback: reverting a StatefulSet's template, then deleting the pod its stuck rollout left behind.
Go deeper
- Healthchecks.io's documentation on configuring checks (opens in a new tab) and its Management API (opens in a new tab).
- The Kubernetes documentation on StatefulSet rolling updates and forced rollback (opens in a new tab).
- Try: change the check's period to 2 minutes, to match the pings that actually arrive. How long would the outage here have taken to be noticed?
- Try: add a second check, pinged by a Kubernetes CronJob that runs every 5 minutes. Then suspend the CronJob, with
kubectl patch cronjob NAME -p '{"spec":{"suspend":true}}', and wait for the check to say down.