By the end you'll know
- What Alertmanager does that Prometheus doesn't
- How routes send alerts to receivers by their labels, and how to test them with
amtool - How grouping turns many alerts into one message, and what its three timers do
- How an inhibit rule hides an alert that another one explains
- How to silence alerts for planned work, and why to do it before the work starts
- Why Alertmanager shows a webhook's address as
<secret> - How to send alerts to Slack without its webhook address ever being in Git
Before you start
- You need: Lesson 7 done, with the bookshop's rules loaded, and the Argo CD port-forward running, with
argocd logindone. - Install amtool, Alertmanager's checking tool. It isn't a Homebrew package of its own: download the release for your Mac from Alertmanager's releases page (opens in a new tab), at the same version as your cluster's Alertmanager, and put
amtoolin~/.local/bin. - For the Slack part: a Slack workspace you're allowed to add apps to. A free one of your own is best: a work workspace may need an admin to approve the app, and your coworkers would see the test alerts.
- This lesson changes things: ten pull requests, including staging broken three times and put back.
- Check where kubectl points:
kubectl config current-contextshould saykind-gitops.
The short version
- Before. Every alert went to a receiver called
null: nowhere. Lesson 7's alerts fired, and reached no one. - A receiver. A tiny web server in the cluster that prints each notification it's sent, standing in for Slack.
- Settings in Git. Bookshop alerts to the receiver; Watchdog, InfoInhibitor and
infoalerts nowhere; grouped by alert and address; BookshopDown hides BookshopPageWrong.amtoolchecked them before the merge. - An outage. Staging at zero pods: two alerts in Prometheus, one message, then a resolved message when it was fixed.
- A silence. Set before changing staging's banner. The alert fired in Prometheus, Alertmanager held it, and the receiver got nothing.
- Slack. The webhook address sealed into Git, mounted into Alertmanager as a file, and the same outage again: firing and resolved messages in a real channel, with Alertmanager counting 4 sent and 0 failed.
What Alertmanager is for
Lesson 7's rules decide that something is wrong. They don't decide who should hear about it, how, or whether at all. That's Alertmanager: Prometheus sends it every firing alert, and Alertmanager does four things with them.
- Routing: which receiver an alert goes to, from its labels. A receiver is a destination: Slack, email, a pager, any web address.
- Grouping: related alerts in one message, instead of one each.
- Inhibiting: when one alert explains another, sending only the first.
- Silencing: a person muting matching alerts for a while, for planned work.
Splitting the jobs means Prometheus can stay simple, and the decisions about people live in one place. In kube-prometheus-stack, Alertmanager is the alertmanager-...-0 pod from Lesson 1, and its settings are a value of the chart.
What it does now
Alertmanager has an API, like Prometheus, on port 9093. A port-forward, and its current settings:
kubectl port-forward -n monitoring svc/alertmanager-operated 9093:9093
curl -s http://localhost:9093/api/v2/status | jq -r '.config.original' | sed -n '/^route:/,/^inhibit_rules:/p'
route:
  receiver: "null"
  group_by:
  - namespace
  continue: false
  routes:
  - receiver: "null"
    matchers:
    - alertname="Watchdog"
    continue: false
  group_wait: 30s
  group_interval: 5m
  repeat_interval: 12h
receivers:
- name: "null"
One receiver, called null, with nothing in it. Every alert goes there: the chart's default is to deliver nothing, until you say where. And what Alertmanager had been sent:
$ am_alerts
active  Watchdog   receivers=null
(am_alerts is a short function that lists Alertmanager's alerts with their state and receiver.) Watchdog, arriving every 30 seconds, as it should, going nowhere. Alertmanager's API calls a firing alert active.
A receiver, inside the cluster
To see notifications without an outside account, a stand-in: a tiny web server that prints what it's sent. In apps/monitoring/alert-receiver.yaml, a Deployment and a Service. The important part:
        - name: receiver
          image: python:3.13-alpine
          command: ["python", "-u", "-c"]
          args:
            - |
              # Print the parts of each notification a person would read, as one line of JSON.
              import http.server, json
              class Handler(http.server.BaseHTTPRequestHandler):
                  def do_POST(self):
                      body = json.loads(self.rfile.read(int(self.headers["Content-Length"])))
                      print(json.dumps({
                          "receiver": body["receiver"],
                          "status": body["status"],
                          "groupLabels": body["groupLabels"],
                          "alerts": [{"alertname": a["labels"]["alertname"], "status": a["status"],
                                      "instance": a["labels"].get("instance", ""),
                                      "summary": a["annotations"].get("summary", "")} for a in body["alerts"]],
                      }))
                      self.send_response(200)
                      self.end_headers()
Alertmanager's webhook receiver sends each notification as a JSON message to a web address. This script reads it, prints the parts a person would read on one line, and answers 200, meaning "got it". -u makes Python print straight away, so kubectl logs shows each line as it arrives. Added to kustomization.yaml's list, then merged as #56:
deployment "alert-receiver" successfully rolled out

NAME                                 READY   STATUS    RESTARTS   AGE
pod/alert-receiver-57b6c5c4b-w8hkl   1/1     Running   0          6s
Alertmanager's settings
The settings, written and checked on their own before going into the chart:
global:
  resolve_timeout: 5m
route:
  # Everything goes to the in-cluster receiver, unless a route below says otherwise.
  receiver: alert-receiver
  # One message per alert name and address: staging's problems separate from production's.
  group_by: [alertname, instance]
  group_wait: 30s       # wait this long after the first alert of a group, for others to join it
  group_interval: 1m    # then send changes to the group at most this often
  repeat_interval: 4h   # and remind about a group still firing this often
  routes:
    # Watchdog always fires and InfoInhibitor is machinery: nobody needs a message (Lesson 10 uses Watchdog).
    - receiver: "null"
      matchers: ['alertname =~ "Watchdog|InfoInhibitor"']
    # info is worth knowing, not worth a message (Lesson 7).
    - receiver: "null"
      matchers: ['severity = "info"']
inhibit_rules:
  # A shop that isn't answering doesn't have the right banner either: one cause, one message.
  - source_matchers: ['alertname = "BookshopDown"']
    target_matchers: ['alertname = "BookshopPageWrong"']
    equal: [instance]
  # The chart's defaults: a critical alert hides the warning about the same thing,
  - source_matchers: ['severity = "critical"']
    target_matchers: ['severity =~ "warning|info"']
    equal: [namespace, alertname]
  # and InfoInhibitor hides info alerts in its namespace.
  - source_matchers: ['alertname = "InfoInhibitor"']
    target_matchers: ['severity = "info"']
    equal: [namespace]
receivers:
  - name: "null"
  - name: alert-receiver
    webhook_configs:
      - url: http://alert-receiver.monitoring.svc:8080/
        send_resolved: true
templates:
  - /etc/alertmanager/config/*.tmpl
The route is a tree. Every alert starts at the top, which says alert-receiver, then tries each child route in order; the first whose matchers fit wins. Watchdog and InfoInhibitor match the first child, and go to null; anything info matches the second. Everything else, the bookshop's alerts included, stays at the top.
Grouping, with group_by: [alertname, instance]: alerts with the same name and address go out together. Three timers control when:
group_wait: 30s: when a group's first alert arrives, wait 30 seconds before sending, in case others join it. One outage, one message.group_interval: 1m: after that, send changes to the group, such as a new alert or one resolving, at most once a minute.repeat_interval: 4h: if nothing changes and it's still firing, remind every 4 hours. Not every 30 seconds.
Inhibit rules hide one alert while another is active. The first is new, for Lesson 7's "one cause, two alerts": while BookshopDown is firing, hide BookshopPageWrong, if equal: [instance], both about the same address. The other two are the chart's defaults, kept: a critical alert hides warnings about the same thing, and InfoInhibitor hides info alerts.
The receiver: webhook_configs, to the receiver's Service, with send_resolved: true, so it's told when a problem ends, not only when it starts.
Checking with amtool
amtool is to Alertmanager what promtool is to Prometheus. First, are the settings valid?
$ amtool check-config /tmp/am-config.yaml
Checking '/tmp/am-config.yaml'  SUCCESS
Found:
 - global config
 - route
 - 3 inhibit rules
 - 2 receivers
 - 1 templates
  SUCCESS
Then the more useful question: given an alert's labels, which receiver does the route pick?
$ amtool config routes test --config.file=/tmp/am-config.yaml alertname=BookshopDown severity=critical
alert-receiver

$ amtool config routes test --config.file=/tmp/am-config.yaml alertname=BookshopPageWrong severity=warning
alert-receiver

$ amtool config routes test --config.file=/tmp/am-config.yaml alertname=Watchdog severity=none
null

$ amtool config routes test --config.file=/tmp/am-config.yaml alertname=CPUThrottlingHigh severity=info
null
Each alert goes where it was meant to, proven before a single real one is sent. A route tree with a dozen branches is easy to get wrong, and this is how to know. Then the settings go into the chart, under alertmanager.config in the monitoring Application's values, indented one level deeper:
        # Where alerts go, how they're grouped, and what hides what (Lesson 8).
        alertmanager:
          config:
            global:
              resolve_timeout: 5m
            route:
              receiver: alert-receiver
              ...
Merged as #57. And a detour worth knowing about.
The address that said <secret>
The first check after merging looked for the receiver's address in the settings Alertmanager reports, and didn't find it. Alertmanager's log said it had loaded new settings:
level=INFO source=coordinator.go:112 msg="Loading configuration file" component=configuration file=/etc/alertmanager/config_out/alertmanager.env.yaml
And its API showed the new route. But the receiver:
- name: alert-receiver
  labels:
    name: alert-receiver
  webhook_configs:
  - send_resolved: true
    http_config:
      follow_redirects: true
      enable_http2: true
    url: <secret>
    url_file: ""
    max_alerts: 0
    timeout: 0s
url: <secret>. Alertmanager treats every webhook address as a secret, and won't show it, even through its own API. Many webhook addresses have a token in them, Slack's included, so anyone who can read the address can post. The address is there, in the Secret the chart made:
$ kubectl get secret -n monitoring alertmanager-monitoring-kube-prometheus-alertmanager -o jsonpath='{.data.alertmanager\.yaml}' | base64 -d | grep -n 'url:'
28:    url: http://alert-receiver.monitoring.svc:8080/
So the settings had loaded; the check was looking for something Alertmanager deliberately hides. It's also a warning for the next part: this address is harmless, but a real one, like Slack's, is a password, and shouldn't sit in Git in plain text the way this one does.
A real outage, and one message
Lesson 7's worst break: staging at zero pods, through Git.
merged: 1414474 Staging: no pods (#58)

after 253s: the receiver got it
{
  "receiver": "alert-receiver",
  "status": "firing",
  "groupLabels": {
    "alertname": "BookshopDown",
    "instance": "http://bookshop.bookshop-staging.svc/"
  },
  "alerts": [
    {
      "alertname": "BookshopDown",
      "status": "firing",
      "instance": "http://bookshop.bookshop-staging.svc/",
      "summary": "The bookshop isn't answering"
    }
  ]
}
A notification, at last: BookshopDown, for staging, with its summary. groupLabels is the group it belongs to, from group_by. (253 seconds is mostly waiting: this time the script didn't ask Argo CD to check Git, so it found the merge on its own, a few minutes later. From the pods going, it's Lesson 7's minute of for, then the 30-second group_wait.)
Then, as in Lesson 7, BookshopPageWrong fired too, in Prometheus:
after 30s: BookshopPageWrong firing in Prometheus

$ am_alerts
active  BookshopDown http://bookshop.bookshop-staging.svc/  receivers=alert-receiver
active  InfoInhibitor   receivers=null
active  Watchdog   receivers=null
suppressed  BookshopPageWrong http://bookshop.bookshop-staging.svc/  receivers=alert-receiver  inhibitedBy=1 alert(s)
{
  "alertname": "BookshopPageWrong",
  "instance": "http://bookshop.bookshop-staging.svc/",
  "status": {
    "inhibitedBy": [
      "844c8bd127884f91"
    ],
    "mutedBy": [],
    "silencedBy": [],
    "state": "suppressed"
  }
}
Suppressed, inhibited by one alert: BookshopDown, for the same address. Alertmanager has it, and holds it. And everything the receiver had been sent:
$ received ... | jq -c '[.status, ([.alerts[].alertname] | join(","))]'
["firing","BookshopDown"]
Two alerts in Prometheus, one message. The person on call hears "the shop isn't answering", not that plus "and the page is wrong", which follows from it. Then the revert:
merged: 2a09eee Revert "Staging: no pods (#58)" (#59)

after 51s: the receiver got it

{"status":"resolved","groupLabels":{"alertname":"BookshopDown","instance":"http://bookshop.bookshop-staging.svc/"},"alerts":[{"alertname":"BookshopDown","status":"resolved"}]}
Resolved, 51 seconds after the merge: send_resolved: true at work. The whole outage, as the receiver saw it:
["firing","BookshopDown"]
["resolved","BookshopDown"]
Two messages: it broke, it's fixed. BookshopPageWrong was never sent at all.
A silence, before the work
Planned work breaks things on purpose. A silence mutes alerts that match, for a set time, so the people on call aren't told about something they already know. Created through Alertmanager's API, before changing anything:
curl -s -X POST http://localhost:9093/api/v2/silences -H 'Content-Type: application/json' -d '{
  "matchers": [{"name": "instance", "value": "http://bookshop.bookshop-staging.svc/", "isRegex": false, "isEqual": true}],
  "startsAt": "NOW", "endsAt": "IN-30-MINUTES",
  "createdBy": "kwamib", "comment": "Changing the staging banner (Monitoring Lesson 8)"
}'
(With real times, in UTC, like 2026-11-05T22:24:54Z.) It answers with the silence's ID. A silence has matchers, like a route; a start and an end; who made it; and why.
active instance=http://bookshop.bookshop-staging.svc/ until 22:54 UTC by kwamib: Changing the staging banner (Monitoring Lesson 8)
Everything about staging's address, for 30 minutes. Then the change, Lesson 5's typo banner:
merged: 142ec47 Staging: a new banner (#60)

after 141s: BookshopPageWrong firing in Prometheus

$ am_alerts
active  InfoInhibitor   receivers=null
active  Watchdog   receivers=null
suppressed  BookshopPageWrong http://bookshop.bookshop-staging.svc/  receivers=alert-receiver  silencedBy=c13f35e7

$ received ... | wc -l
       0
Firing in Prometheus, suppressed in Alertmanager, silenced by c13f35e7, and nothing sent. Then the revert, and the silence ended by hand, instead of waiting for its 30 minutes:
merged: 69eac53 Revert "Staging: a new banner (#60)" (#61)
after 10s: BookshopPageWrong inactive in Prometheus

$ curl -s -X DELETE http://localhost:9093/api/v2/silence/c13f35e7-1f32-4d9f-b620-946d18440932 -o /dev/null -w '%{http_code}\n'
200

expired

$ received ... | wc -l
       0
Expired, and still nothing sent. Alertmanager's web interface, at http://localhost:9093 with the port-forward running, has a Silences page that does the same with a form, and amtool silence add does it from a terminal.
Slack, with the address sealed
The in-cluster receiver proved the settings work. Now a real destination. Slack's incoming webhook is a web address that posts whatever it's sent into one channel, and Alertmanager has a receiver type made for it, slack_configs. The catch, from the <secret> detour: the address is the password. Anyone who has it can post in your channel. So it goes into Git the way Lesson 10 of the Argo CD track put passwords there: sealed.
Make the webhook
Webhooks belong to a Slack app. Here, an app is just a container for settings: no code, nothing published, visible only in your workspace.
- In a web browser (not the Slack app), open api.slack.com/apps (opens in a new tab) and choose Create New App, then From scratch. Name it
Alertmanagerand pick your workspace. - In the app's left sidebar, under Features, choose Incoming Webhooks and switch it On.
- At the bottom of the page, choose Add New Webhook, pick a channel such as
#alerts, and Allow. - Copy the address with the Copy button in the table. It starts with
https://hooks.slack.com/services/.
Two traps here, both easy to fall into. Slack's documentation shows sample responses with an address full of XXXXX: that's an example, not yours. And once a webhook exists, the page's sample curl box fills in your real address, so copying from that box picks up the whole command, not just the address.
Save it, outside Git
Into a file in the repository folder, without it ever showing on screen:
read -rs "W?Paste the Slack webhook, then press Enter: " && printf '%s' "$W" > .slack-webhook && unset W
chmod 600 .slack-webhook
echo '.slack-webhook' >> .gitignore
cut -c1-34 .slack-webhook; echo
read -rs "W?..."shows the prompt after?and stores what you paste inW.-shides it as you paste, and-rkeeps it exactly as typed. (The?prompt is how zsh, the Mac's default shell, writes it.)printf '%s' "$W" > .slack-webhookwrites it to the file, with no line break, andunset Wclears it from the shell.chmod 600makes it readable only by you, and the.gitignoreline means Git won't offer to commit it.cut -c1-34prints only the first 34 characters,https://hooks.slack.com/services/T, proof you saved an address without showing the secret part.
Why not pbpaste > .slack-webhook? It saves whatever is on the clipboard at that moment, and copying the command to run it replaces the address you'd copied before. That happened here: the file held the commands, and the script's first check refused it.
$ ls -l .slack-webhook; git check-ignore -v .slack-webhook
-rw-------  1 mayowababatola  staff  81 Nov  5 18:35 .slack-webhook
.gitignore:4:.slack-webhook	.slack-webhook
Seal it
The same steps as the Grafana password in Lesson 1, into apps/monitoring/alertmanager-slack.yaml:
kubectl create secret generic alertmanager-slack -n monitoring \
  --from-file=url=.slack-webhook --dry-run=client -o yaml | kubeseal -o yaml \
  > apps/monitoring/alertmanager-slack.yaml
grep -c hooks.slack.com apps/monitoring/alertmanager-slack.yaml
kubectl create secret generic ... --dry-run=client -o yamlwrites a Secret namedalertmanager-slack, with one key,url, holding the file's contents, and prints it instead of creating it.kubeseal -o yamlencrypts it with the cluster's Sealed Secrets key. Only the controller in the cluster can open it.grep -c hooks.slack.comcounts the lines with the address in plain text:
0
None. Added to kustomization.yaml's list, merged as #62, and the controller turned it back into a Secret:
NAME                                          STATUS   SYNCED   AGE
sealedsecret.bitnami.com/alertmanager-slack            True     5s

NAME                        TYPE     DATA   AGE
secret/alertmanager-slack   Opaque   1      5s
Tell Alertmanager to use it
Two changes in the monitoring Application's values. First, mount the Secret into Alertmanager's pod:
        alertmanager:
          alertmanagerSpec:
            # Mount the sealed Slack address at /etc/alertmanager/secrets/alertmanager-slack/url.
            secrets:
              - alertmanager-slack
The Prometheus Operator mounts each Secret listed under secrets at /etc/alertmanager/secrets/NAME/, one file per key. Then the receiver, renamed bookshop-team, with Slack beside the in-cluster webhook:
receivers:
  - name: "null"
  - name: bookshop-team
    # Both: the in-cluster receiver, and Slack.
    webhook_configs:
      - url: http://alert-receiver.monitoring.svc:8080/
        send_resolved: true
    slack_configs:
      # The webhook address is a password: it's read from a file, mounted from the sealed Secret.
      - api_url_file: /etc/alertmanager/secrets/alertmanager-slack/url
        send_resolved: true
        title: '{{ if eq .Status "firing" }}Firing{{ else }}Resolved{{ end }}: {{ .CommonLabels.alertname }}'
        text: '{{ range .Alerts }}{{ .Annotations.summary }} ({{ .Labels.severity }}): {{ .Annotations.description }}{{ "\n" }}{{ end }}'
api_url_fileinstead ofapi_url: Alertmanager reads the address from the file when it sends. The settings in Git hold only a path.titleandtextare Go templates..Statusisfiringorresolvedfor the whole message;.CommonLabelsare the labels every alert in the group shares;range .Alertswrites one line per alert, from each rule'ssummaryanddescriptionannotations in Lesson 7.- The route's top
receiver:changes tobookshop-teamtoo.
Checked with amtool first, then merged as #63:
$ amtool check-config /tmp/am-config.yaml
Checking '/tmp/am-config.yaml'  SUCCESS
...
 - 2 receivers

$ amtool config routes test --config.file=/tmp/am-config.yaml alertname=BookshopDown severity=critical
bookshop-team
A check that passed too early
The first run of this lesson's script gave up here, saying Alertmanager hadn't loaded the Slack settings within 3 minutes. They loaded fine; the script asked too soon. It had waited for the monitoring app to be Synced and Healthy, but that was already true before Argo CD noticed the merge, and kubectl rollout status said "complete" for the same reason: nothing had changed yet. The two runs' revisions show it:
statefulset rolling update complete 1 pods at revision alertmanager-monitoring-kube-prometheus-alertmanager-86bd595b59...
statefulset rolling update complete 1 pods at revision alertmanager-monitoring-kube-prometheus-alertmanager-59ccfc8b6d...
The first is the old pod; the second, minutes later, the new one. The fix was to wait for each step in order, each proving the one before: Argo CD on the new commit, the Secret in the pod's volumes, the operator's generated settings containing api_url_file, then Alertmanager running them:
$ kubectl get statefulset alertmanager-monitoring-kube-prometheus-alertmanager -n monitoring -o json | jq -r '.spec.template.spec.volumes[].secret.secretName // empty'
alertmanager-monitoring-kube-prometheus-alertmanager-generated
alertmanager-slack
alertmanager-monitoring-kube-prometheus-alertmanager-web-config
alertmanager-monitoring-kube-prometheus-alertmanager-cluster-tls-config
$ curl -s http://localhost:9094/api/v2/status | jq -r '.config.original' | sed -n '/slack_configs:/,/title:/p'
  slack_configs:
  - send_resolved: true
    http_config:
      follow_redirects: true
      enable_http2: true
    api_url_file: /etc/alertmanager/secrets/alertmanager-slack/url
    app_url: https://slack.com/api/chat.postMessage
alertmanager-slack is mounted, and Alertmanager shows the path, never the address. "Ready" checks only mean something if they can tell old from new.
A test message
Before breaking anything, a made-up alert sent straight to Alertmanager, ending by itself after 2 minutes:
amtool alert add --alertmanager.url=http://localhost:9094 \
  alertname=SlackTest severity=warning instance=lesson-8 \
  --annotation='summary="A test from Monitoring Lesson 8"' \
  --annotation='description="If you can read this in Slack, the webhook works."' \
  --end=$(date -u -v+2M +%Y-%m-%dT%H:%M:%SZ)
amtool alert addpretends to be Prometheus: labels first, then annotations, then when it ends.date -u -v+2Mis the Mac's way of saying "2 minutes from now, in UTC".- The double quotes inside the annotations matter: without them,
amtoolwarns that its new parser can't read text with spaces, and falls back to the old one. This lesson's run printed exactly that warning, and still worked.
Alertmanager counts what each kind of receiver sends, and what fails, on its own metrics page:
curl -s http://localhost:9094/metrics | grep -E '^alertmanager_notifications(_failed)?_total\{.*integration="slack"'
Added up, before and after:
alertmanager_notifications_failed_total 0
alertmanager_notifications_total 0

after 31s: the receiver got it

alertmanager_notifications_failed_total 0
alertmanager_notifications_total 1
One sent, none failed. If the address were wrong or revoked, Slack would refuse it, and failed_total would go up instead.
The outage again, in Slack
Staging at zero pods, #64, then the revert, #65, with the count after each message:
after 142s: the receiver got it
alertmanager_notifications_total 3

after 40s: the receiver got it
alertmanager_notifications_total 4
alertmanager_notifications_failed_total 0
$ received ... | jq -c '[.status, ([.alerts[].alertname] | join(","))]'
["firing","SlackTest"]
["resolved","SlackTest"]
["firing","BookshopDown"]
["resolved","BookshopDown"]
And the channel:
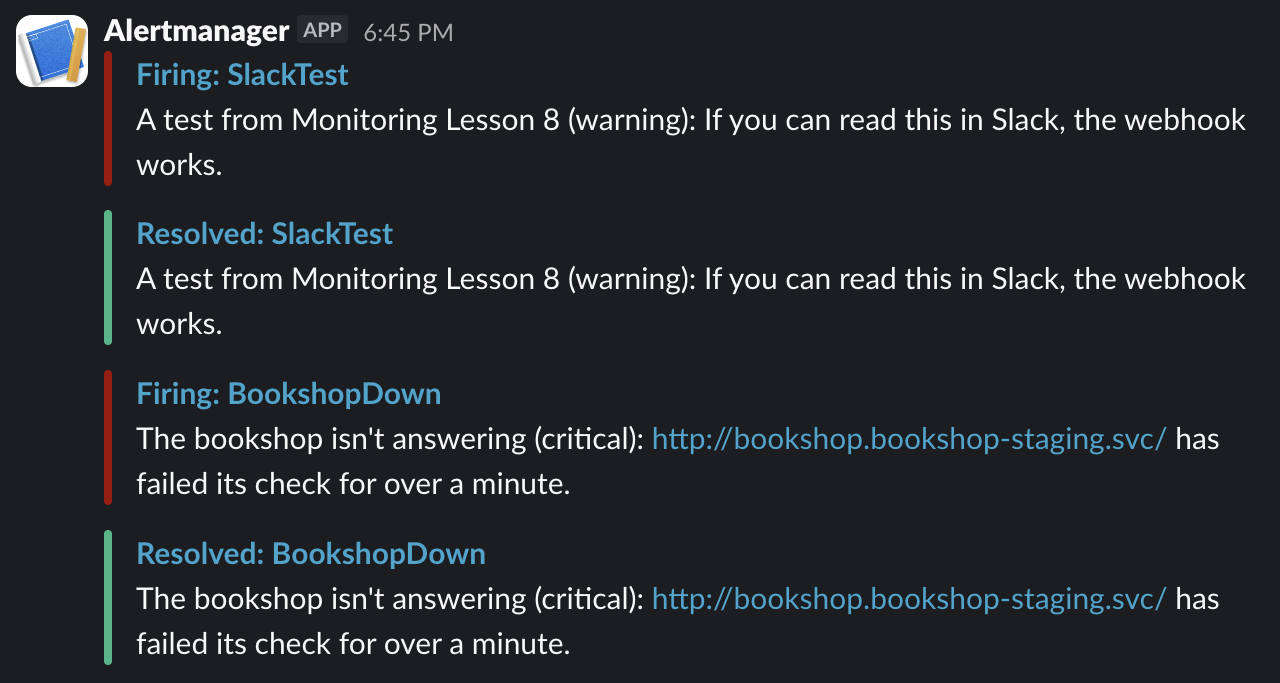
Red bars for firing, green for resolved: that's the Slack receiver's default color. BookshopPageWrong isn't there; the inhibit rule held it, in Slack as in the receiver. And notice the resolved messages: they repeat the annotations, so "The bookshop isn't answering" appears under Resolved. Annotations describe the problem, not its state; the title is what says it's over. Worth remembering when writing them.
In real systems
- Route by severity and team. A common tree:
criticalto a pager such as PagerDuty, which phones someone;warningto a team's Slack channel;infonowhere. And a child route per team, matched on ateamlabel, so each team hears about its own services. - Inhibit with care. An inhibit rule that's too broad hides real problems. Keep
equal:tight, as here, so a cause only hides alerts about the same thing. - Silence before, not during. Create the silence before the work, with an end time and a comment saying who and why. A silence with no end, or no reason, is how real alerts get missed for weeks.
- One webhook per channel, and treat each as a password. If one leaks, remove it from the app's Incoming Webhooks page and seal a new one; the others keep working. Rotating it is the same sealing steps, one pull request.
- Point Slack at a channel people read. A channel that's all alerts, all day, gets muted.
warningandcriticalonly, as here, keeps it worth reading. - Run two Alertmanagers, or more. In production, Alertmanager runs as a small cluster, so one failing doesn't mean alerts go unsent. Here,
cluster.statussaiddisabled: one copy, fine for a laptop.
Spot the problem
Work out what's wrong before you read the explanation.
The silence that hid the outage. A team upgrades their database on a Saturday morning. To avoid alerts during the work, someone creates a silence: namespace = "shop", for 24 hours, "database upgrade". The upgrade goes fine by 10 a.m. At 3 p.m., a bad release takes the shop down. Nobody is told until Monday, when the weekend's lost orders are noticed. What went wrong? The silence was far too wide, and far too long. It matched everything in the namespace, not just the database's alerts, and lasted all day for two hours of work. Every alert about the shop, the outage included, was firing and suppressed, exactly as staging's banner was here. Three habits prevent it: match as narrowly as possible (the database's alerts, not the namespace), end it soon after the work should be done, and expire it as soon as the work is, as this lesson did with DELETE. Alertmanager's Silences page shows every active silence; a team that glances at it every morning catches the forgotten ones.
Keep this
| To | Use |
|---|---|
| Reach Alertmanager | kubectl port-forward -n monitoring svc/alertmanager-operated 9093:9093 |
| Its current settings | curl -s localhost:9093/api/v2/status | jq -r .config.original |
| Its alerts, and why one is held | curl -s localhost:9093/api/v2/alerts | jq '.[].status' |
| Set its settings, in Git | alertmanager.config in the chart's values |
| Send to a web address | A receiver with webhook_configs, and send_resolved: true |
| Send something nowhere | A route to a receiver with no settings, such as "null" |
| One message per outage | group_by, group_wait, group_interval, repeat_interval |
| Hide an alert another explains | An inhibit rule: source_matchers, target_matchers, equal |
| Check the settings | amtool check-config FILE |
| Which receiver an alert gets | amtool config routes test --config.file=FILE LABEL=VALUE ... |
| Silence, for planned work | POST /api/v2/silences, the web interface, or amtool silence add |
| End a silence early | DELETE /api/v2/silence/ID |
| Send to Slack | A receiver with slack_configs, and api_url_file pointing at a mounted Secret |
| Mount a Secret into Alertmanager | alertmanager.alertmanagerSpec.secrets: lands at /etc/alertmanager/secrets/NAME/KEY |
| Send a test alert | amtool alert add alertname=NAME ... --end=TIME |
| Count what was sent, and what failed | alertmanager_notifications_total and alertmanager_notifications_failed_total, by integration |
Where you are now
Alerts reach people now: routed by name and severity, grouped so one outage is one message, a cause hiding its effects, silenced for planned work, and delivered to a Slack channel, with the address that makes that possible sealed in Git and never shown. Metrics say that something is wrong. The next lesson adds the other half of finding out why: logs, with Loki, searchable in the same Grafana.
Check yourself
What does Alertmanager do that Prometheus doesn't?
Before this lesson, where did Lesson 7's alerts go?
What does group_wait: 30s do?
Staging had no pods. Why was BookshopPageWrong never sent?
Why did the API hide the webhook address?
A silence matched staging's address. What happened to the alert?
Why use api_url_file instead of api_url for Slack?
What proves Slack accepted the messages?
Key terms
- Alertmanager: receives alerts from Prometheus, and decides who hears about them, how and when.
- Receiver: a destination for notifications, such as Slack, email, a pager or a web address.
- Route: a rule picking a receiver from an alert's labels; routes form a tree, and the first child that matches wins.
- Grouping: sending related alerts as one notification, by the labels in
group_by. - Inhibition: hiding an alert while another, which explains it, is firing.
- Silence: muting matching alerts for a set time, for planned work.
- Webhook: a notification sent as a message to a web address.
- Incoming webhook: Slack's web address that posts whatever it's sent into one channel; the address itself is the password.
- api_url_file: a Slack receiver setting that reads the address from a file, so the settings never contain it.
- amtool: Alertmanager's tool for checking settings, testing routes and managing silences.
Go deeper
- The Alertmanager documentation: concepts (opens in a new tab) and configuration (opens in a new tab), and the routing tree editor (opens in a new tab), which draws a route tree from your settings.
- Try: open
http://localhost:9093with the port-forward running. Create a silence from the Silences page, then expire it. Which fields does the form ask for, and why each? - Try: add a child route that sends only
severity = "critical"alerts to a second webhook receiver. Test it withamtool config routes testbefore merging. - The Slack receiver settings (opens in a new tab), and Slack's own guide to incoming webhooks (opens in a new tab).
- Try: change the Slack
texttemplate so resolved messages say "fixed" instead of repeating the problem. Hint:.Statusworks insiderange .Alertstoo, as each alert's own status.